Why Every Trading Strategy Starts With a Stock Screen
Roughly 500 names in the S&P 500. Another three thousand or so listed across the NYSE and Nasdaq once you look past the index. On an ordinary Tuesday, a couple of hundred of them are doing something that would catch your eye on a chart.
Nobody can trade two hundred things. So before any of the stuff traders actually argue about online, before entries and stops and whether you scale in or take the full size at once, there is a duller question that gets almost no attention: which of these am I even allowed to look at today?
Get that wrong and nothing downstream rescues you. Flawless discipline applied to a bad shortlist just means losing money on a schedule.
A stock screener is where your trading philosophy finally gets written down precisely enough that somebody could check whether it works.
Most traders never get that far. The screener becomes a search box, the philosophy stays a feeling, and the two never quite meet in the middle.
The Trading Philosophies Behind Every Stock Screen
Every screen is an argument about why a stock should move. It helps to know how many arguments are on the table, because most of us are running two or three at once without ever having admitted it.
Reading price and structure
- Trend following. Buy strength, sell weakness, assume moves persist longer than they should. Moving averages, higher highs, breakouts from consolidation.
- Mean reversion. The opposite wager: moves overshoot and snap back. RSI extremes, distance from a 20-day or 50-day average, excursions outside a Bollinger band.
- Price action, or the naked chart. No technical indicators at all. Swing highs and lows, prior support, and above all how price behaves at a level rather than near it.
- Classical chart patterns. Flags, triangles, head and shoulders, cup and handle. Older than most of us and still the vocabulary half the market thinks in.
- Candlestick patterns. Hammers, engulfings, morning stars, inside bars. These are claims about the anatomy of one to three specific bars, which makes them the most precise and the most easily fooled.
- Volatility contraction. Range narrows, ATR falls, volume dries up, and then something happens. The setup is the quiet, not the move.
Reading participation
- Volume analysis. Dry-up into a base, expansion on the break, price relative to VWAP, accumulation against distribution.
- Relative strength. Not “is this going up” but “is this going up more than everything else.” A ranking problem rather than a threshold problem, which is why so many screeners handle it badly.
- Liquidity and microstructure. Spreads, opening-range behaviour, where the size actually prints. Almost entirely an intraday concern and largely irrelevant if you hold for weeks.
Reading the business
- Value. Pay less than the thing is worth. Low P/E, low P/B, EV/EBITDA under whatever number you have decided is cheap.
- Quality and GARP. High return on equity and on capital employed, margins that survive a downturn, at a multiple that is merely uncomfortable rather than absurd.
- Growth. Revenue and earnings compounding fast enough to justify paying up.
- Dividend and income. Yield, payout ratio, and whether free cash flow actually covers the distribution.
- Deep value and distress. Buying below book, or buying the balance-sheet repair before it shows up in earnings.
- Quant factor screening. Value, momentum, quality, low volatility and size treated as explicit ranked factors rather than as opinions.
Reading catalysts
- Event-driven. Earnings, guidance revisions, M&A, index inclusion, spin-offs, corporate actions.
- News and sentiment. Trade the reaction, or trade the fade of the reaction. Two different strategies wearing the same coat.
- Insider and institutional activity. Officers buying their own stock, 13F accumulation, cluster buys.
- Sector rotation and top-down macro. Pick the group first, then find the cleanest expression of it.
- Seasonality. Patterns tied to the calendar. Thin evidence in most cases, but people trade it.
- Pairs and relative value. Long one, short the correlated other, bet on the spread rather than the direction.
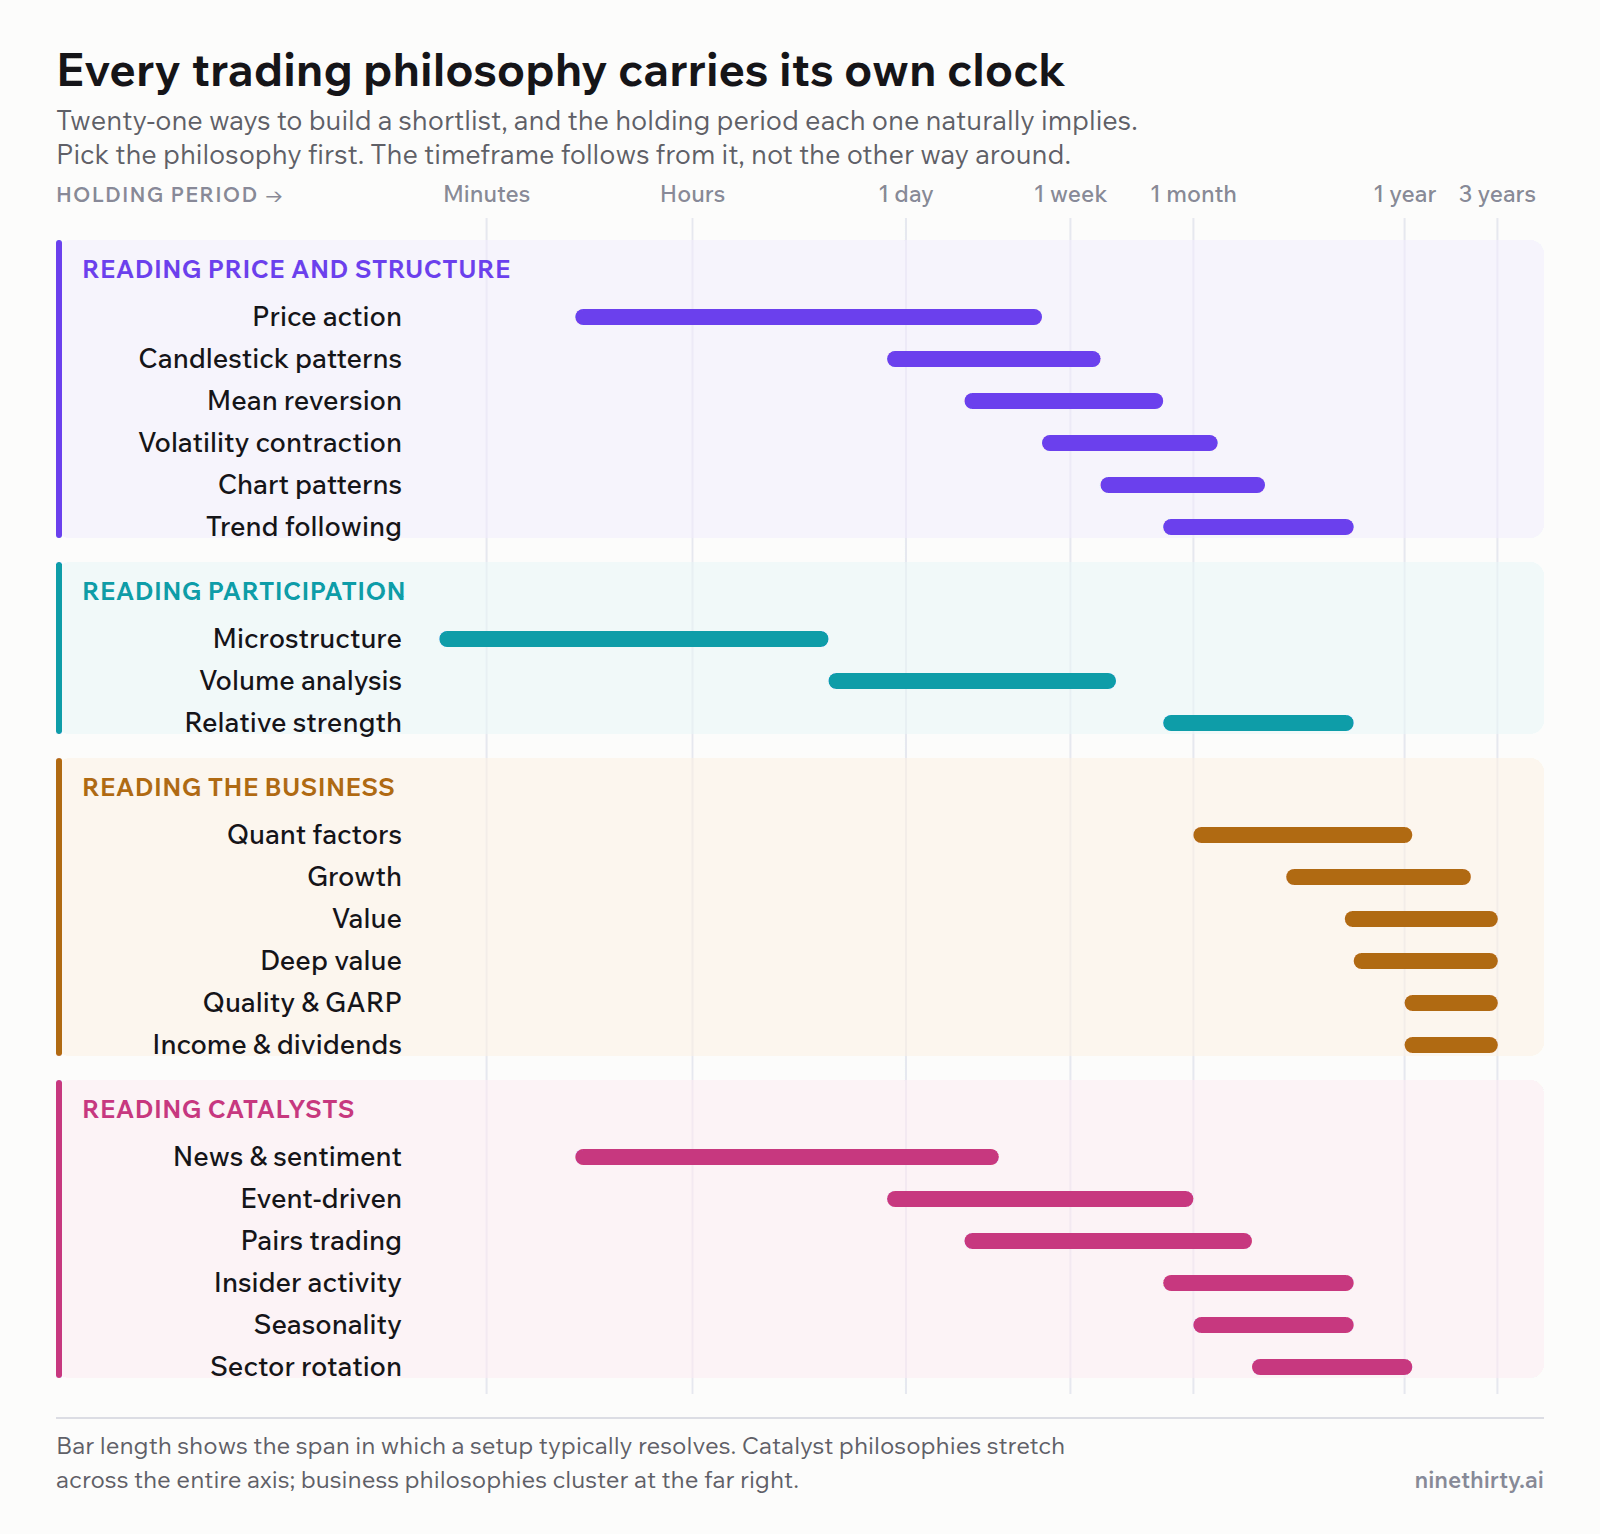
Each of these drags a clock along behind it, and that is the second decision you are making without noticing. Microstructure plays are dead by the close. Candlestick and mean-reversion setups resolve in three to ten sessions. Chart patterns and trend trades want weeks. A quality or deep-value thesis needs quarters, sometimes years, because that is simply how long a business takes to change.
Which means the philosophy picks the timeframe, and not the reverse. I have watched a lot of people decide they want to be day traders and then go looking for something to fill the day with. It shows up in the P&L within about a quarter.
No Screening Condition Works Alone
Here is the awkward part. Ask any trader with a real track record what their criteria are, and you will not find a pure play anywhere in it.
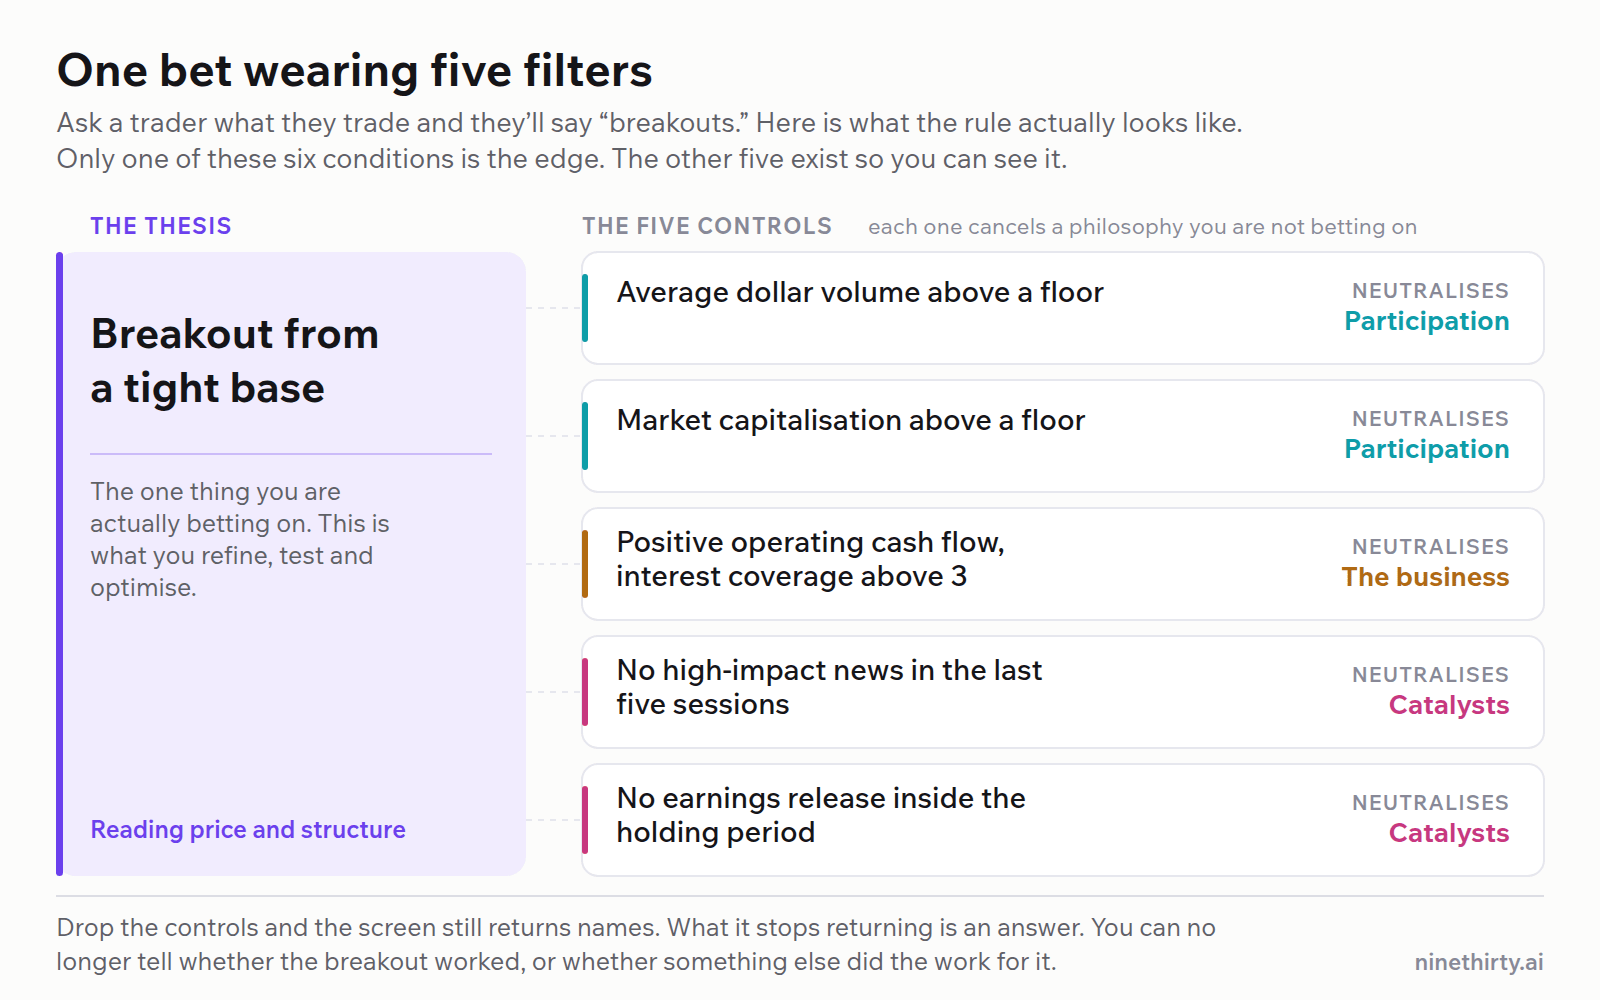
They will tell you they trade breakouts. Then you watch them pass on four breakouts in a row, and the actual rule turns out to be something closer to: a breakout from a tight base, in a name that does twenty million dollars a day so I can get out of it, big enough that one desk cannot walk it around, in a sector that is not actively bleeding, with no earnings print inside my holding period and nothing strange in the news.
That is not one philosophy. That is one bet with five bodyguards.
And they are right to trade that way. Blending is how anyone survives past their first bad quarter. Markets do not respect the boundaries between disciplines, so a shortlist that does will get run over. The same cup-and-handle on a company burning cash is a different animal from the one on a company generating it, even though on the chart the two are pixel-identical.
Which leaves us with the question this whole piece exists to answer. If nothing works alone, and every real setup is a blend, how do you ever find out which part of the blend is carrying the weight?
Thesis Conditions and Control Conditions
Every line in a well-built screen is doing one of two jobs, and separating them is most of the battle.
Thesis conditions are the bet. They are the reason the trade exists at all, and they are the only things you are allowed to fiddle with when you research.
Control conditions cancel out the philosophies you are not betting on, so that when a trade works or fails you can say something useful about why.
The two senses of the word sit on top of each other, which is the small joke in the title. No condition works in isolation, and that is precisely why you have to isolate the one you care about. The other conditions are not part of your edge. They are there so the edge becomes visible.
Drop them and the screen does not get simpler. It gets unreadable.
Say you screen for a bullish MACD crossover, take twenty of them over a couple of months, and finish net positive. Fine. What did you actually learn? Six of those names had earnings inside the window. Three traded under a million dollars a day, so your own fill moved the tape. Two ran on an acquisition rumour and would have gone up if you had bought them upside down. Your crossover might be a real edge. It might also be a decoration sitting on top of four other effects, and from where you are standing there is no way to tell, which means there is no way to improve it either.
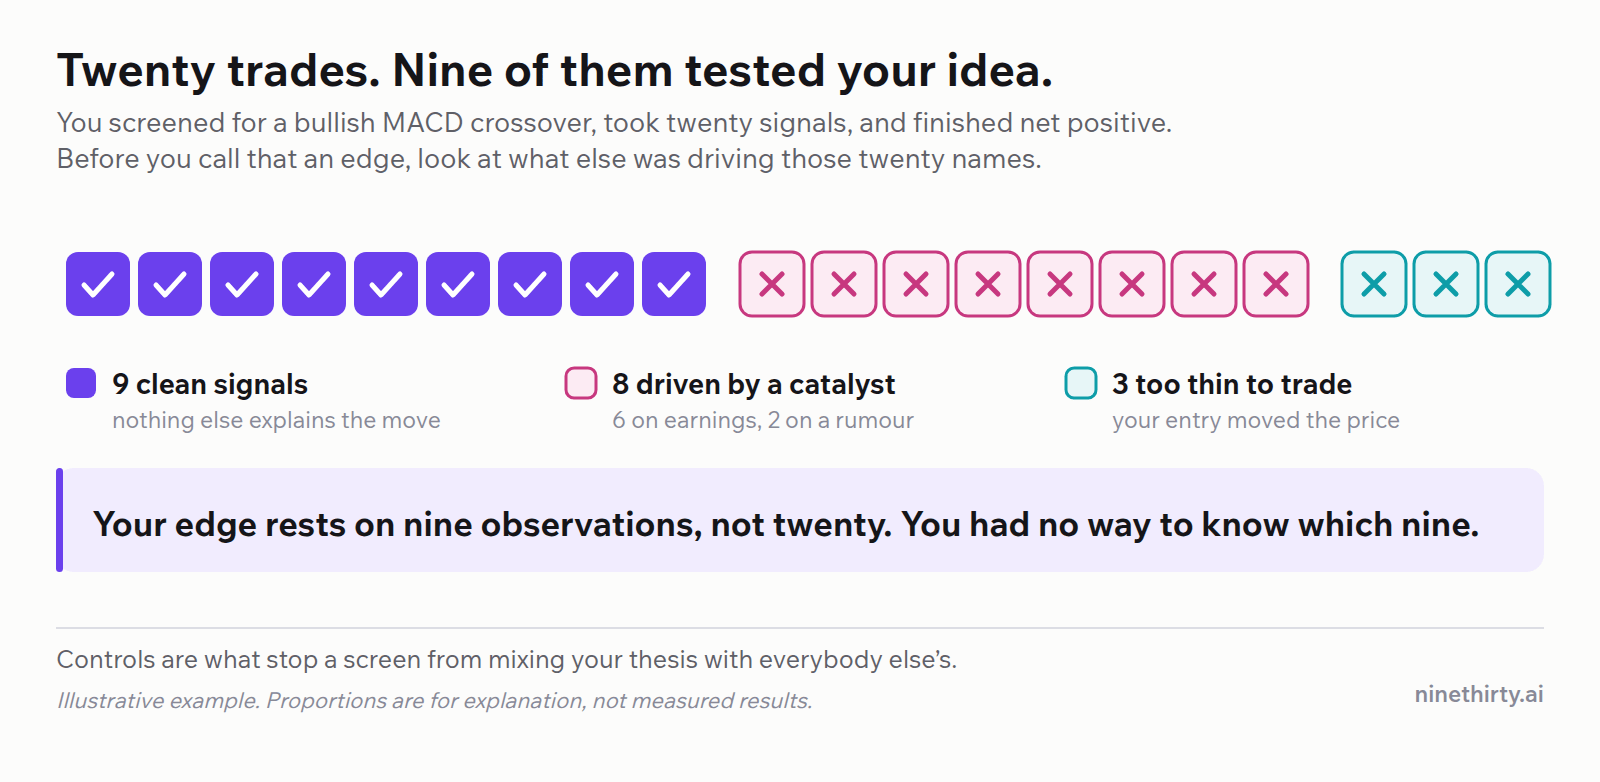
Controls are the difference between a screen and a lottery ticket.
How to Isolate a Technical, Fundamental or News-Driven Setup
What you control for depends entirely on what you are betting on. Four cases cover most of it.
Isolating a technical setup. The thesis is that the pattern predicts the move, so every other reason the move could have happened has to go.
- Liquidity. A floor on average dollar volume, somewhere north of ten or twenty million depending on your size. A beautiful chart you cannot exit is a screenshot, not a trade.
- Market cap and float. Small, tightly held names are cheap to push around. Their “patterns” are frequently somebody’s intention rather than the market’s opinion, and you will not know which until you are in.
- Financial viability. Positive operating cash flow, interest coverage that is not flirting with one, debt inside something sane. A textbook base on a company three weeks from a covenant breach is not a base.
- Catalyst contamination. No high-impact news inside the window where the pattern formed. If the breakout arrived the same morning as an upgrade, the breakout was a passenger.
- Event proximity. No earnings inside the intended hold, unless earnings is the thesis.
- Volatility regime. An ATR band. Otherwise you are grouping a name that moves 2% a day with one that moves 9% and calling the result a strategy.
Isolating a fundamental thesis. The bet is that the business is sound and the price is wrong. The controls exist to stop you being right and early, which pays exactly the same as being wrong.
Compare valuation against the sector rather than against a number you picked, because fourteen times earnings is cheap in software and expensive in a regulated utility, and an absolute P/E filter quietly turns into a sector bet you never intended to place. Require no negative high-impact news in the recent window, since cheap and cheap-for-a-reason look identical on a screener. Keep price above its 200-day so you are buying neglect rather than a slide. Watch for clusters of insider selling while you are accumulating. And look at the trend in the fundamentals across four or five reports rather than the level in the most recent one, because a single flattering quarter is the easiest thing in the world to produce.
Isolating a news trade. Now flip the whole thing over. News is the thesis, so the technicals become the controls. The gap has to hold above VWAP rather than fading into the prior range. Liquidity has to be real, because catalyst trades are where slippage quietly eats whatever the catalyst gave you. And the move has to be idiosyncratic. If the entire sector is up four percent, you do not have a stock trade, you have expensive beta with extra steps.
Isolating a mean-reversion trade. The bet is that the selloff was emotional, so the control is evidence that it was not structural. Fundamentals steady across recent reports while price stretches to an extreme. A stock down thirty percent because the business is deteriorating is not oversold. It is being priced correctly, in public, in real time.
There is a fifth case that catches people constantly, and it is worth naming. Sector rotation. The bet is about the group, so the control has to stop you picking the worst expression of a good idea. Screen the stock against its own sector rather than against the market and you will find that a good half of the names riding a hot sector are underperforming the trend you are trying to own.
Backtest the Filters, Not Just the Strategy
Here is where all of this stops being a mental model and starts paying rent. Once the thesis and the controls are separable, they are also testable.
Run the screen with everything in place. Write down the win rate and the average return. Now take out exactly one control and run it again.
If the numbers barely twitch, that control was decorative. It was shrinking your candidate list and making you feel thorough, and you can drop it. If the numbers fall apart, it was load-bearing, and the correct response is usually to tighten it rather than relax it.
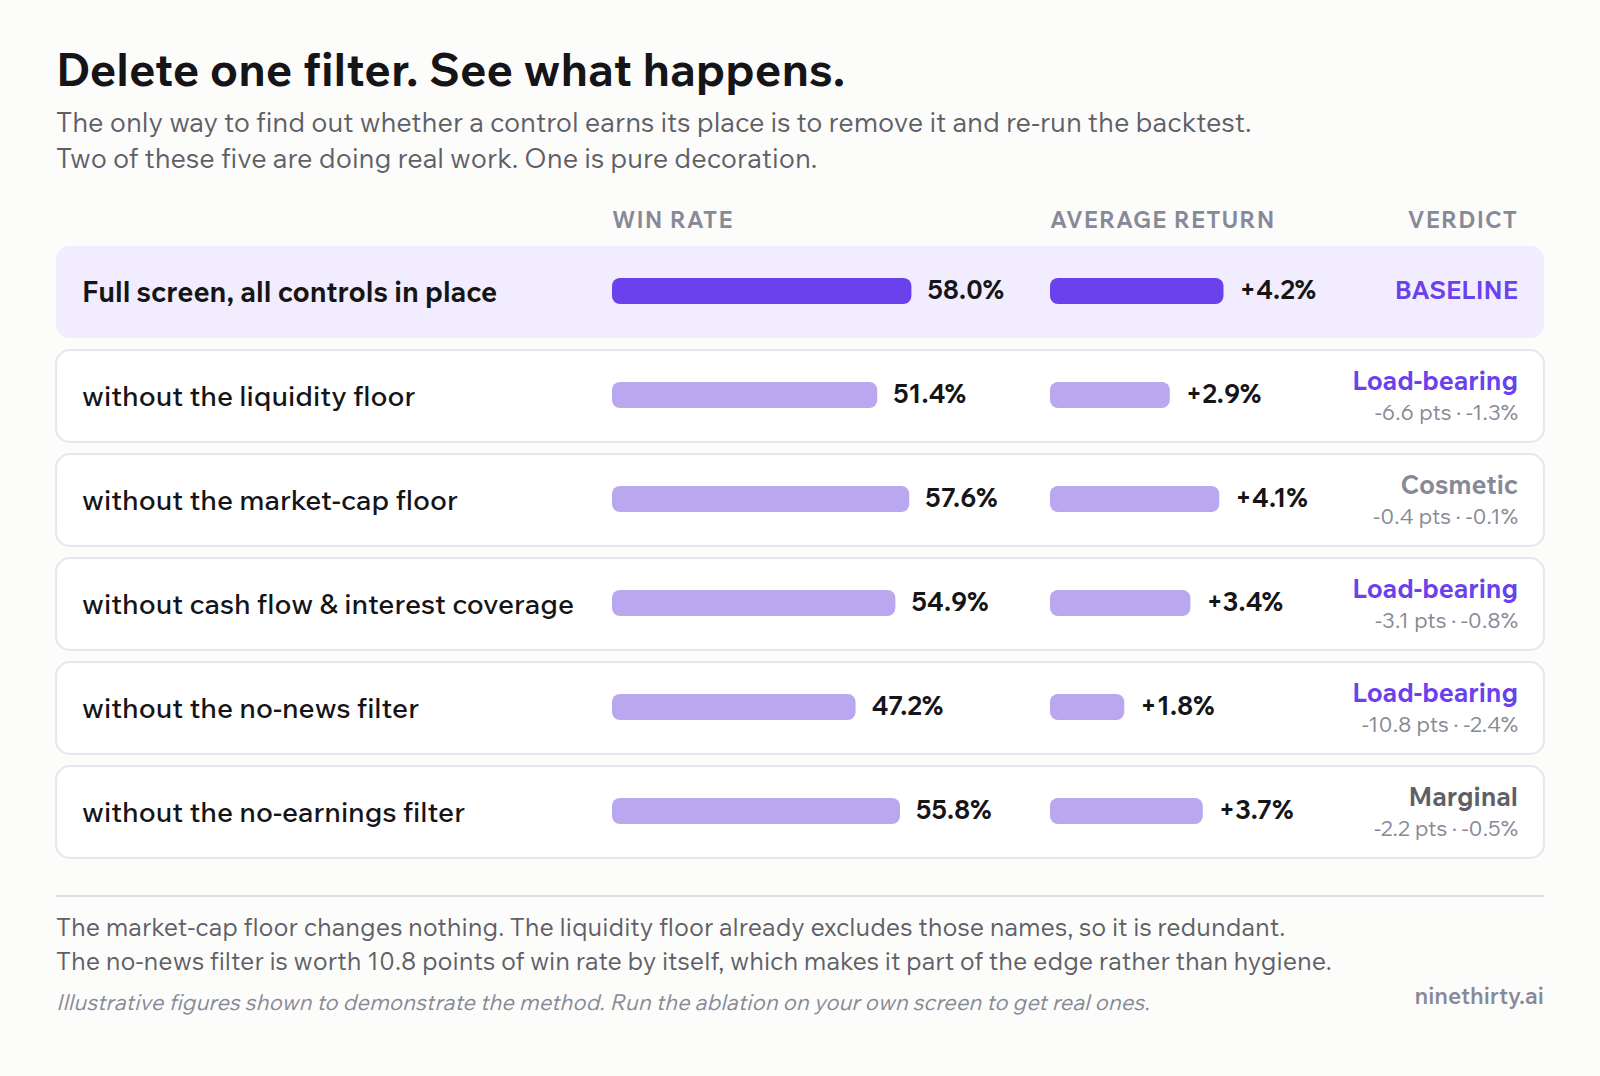
Statisticians call this an ablation. Traders mostly do not call it anything, because most traders never do it. Work through your controls one at a time and you end up somewhere unusual: a setup where you can name every condition in it and say what each one is for. Two warnings, though. Keep the sample honest, because at thirty trades you are reading noise and telling yourself it is signal. And resist the urge to keep pruning until the backtest is beautiful, since that is just overfitting with extra ceremony.
What This Demands of a Stock Screener
Go back through those five cases and look at what each one quietly assumes you can ask for.
Price across more than one timeframe, because the context and the trigger almost never live on the same chart. Fundamentals across several reporting periods, since a trend in the numbers says something a single number cannot. Valuation measured against a sector rather than a fixed threshold. News filtered by impact and sentiment and recency, and, most importantly, the ability to require that nothing happened at all. Insider transactions. The events calendar.
All of it resolving in one screen, on the same bar.
Not three CSV exports intersected in a spreadsheet on a Sunday afternoon. That produces a shortlist, sure, but it produces one you can never backtest, because as a strategy it does not exist anywhere except in your head and a VLOOKUP.
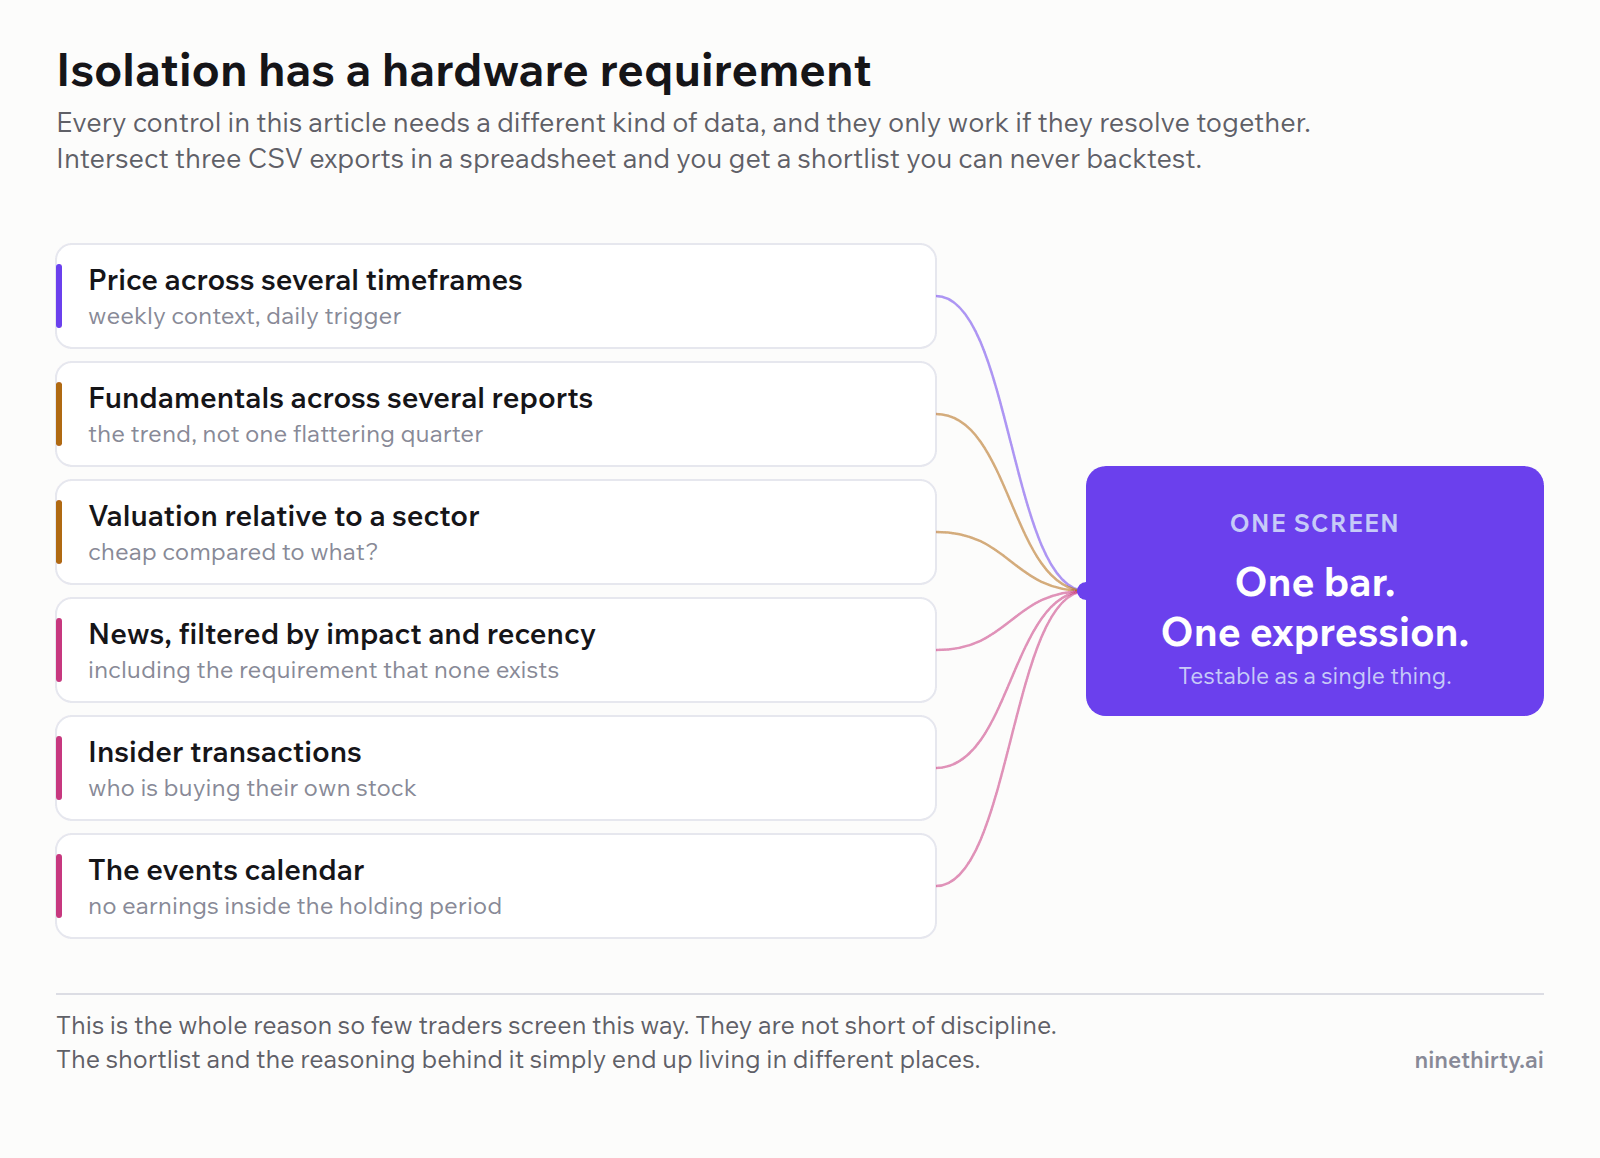
That is a demanding list, and it is the real reason so few people screen this way. It has very little to do with discipline. The shortlist ends up in one tool and the reasoning behind it ends up in another, and after a while nobody remembers which conditions were the bet.
In the next post I will take a single setup and build the whole thing end to end. Thesis first, then each control added deliberately, then the ablation run across every one of them.
Until then the discipline stands on its own, whatever you screen with. Before your next trade, write down which single condition is the bet. Then go down the rest of the list and ask what each one is neutralising. Anything you cannot answer for is not a control. It is just a habit you picked up somewhere.
If you would rather not wait for that post, the NineThirty screener is already live. Build one of these setups in it and the difference shows up quickly, because thesis and controls sit in a single expression, with price, technical indicators, fundamentals, valuation, news and insider activity all resolving on the same bar. It solves the problem from a different direction, and that is easier to see than to describe.
DISCLAIMER: This article is for educational and informational purposes only. It does not constitute investment advice or a research report.