In March 2024 the Securities and Exchange Commission settled charges against two investment advisers for making false and misleading statements about their use of artificial intelligence. The firms paid $400,000 in total civil penalties. The Commission’s own word for the behaviour was AI washing, and the enforcement director’s summary was blunt: if you claim to use AI in your investment process, your representations had better not be false.
That is the backdrop to any search for the best AI for equity analysis. The label now sits on a chat window, a number between one and ten, a multi-agent research system and a metered add-on inside a charting package. Those four things behave differently, cost differently and fail differently. Picking between them by reading marketing copy is how people end up paying for a category they did not want.
This post separates the categories, gives four questions that actually sort them, and says plainly where our own product fits and where it stops.
What does “AI for equity analysis” mean in practice?
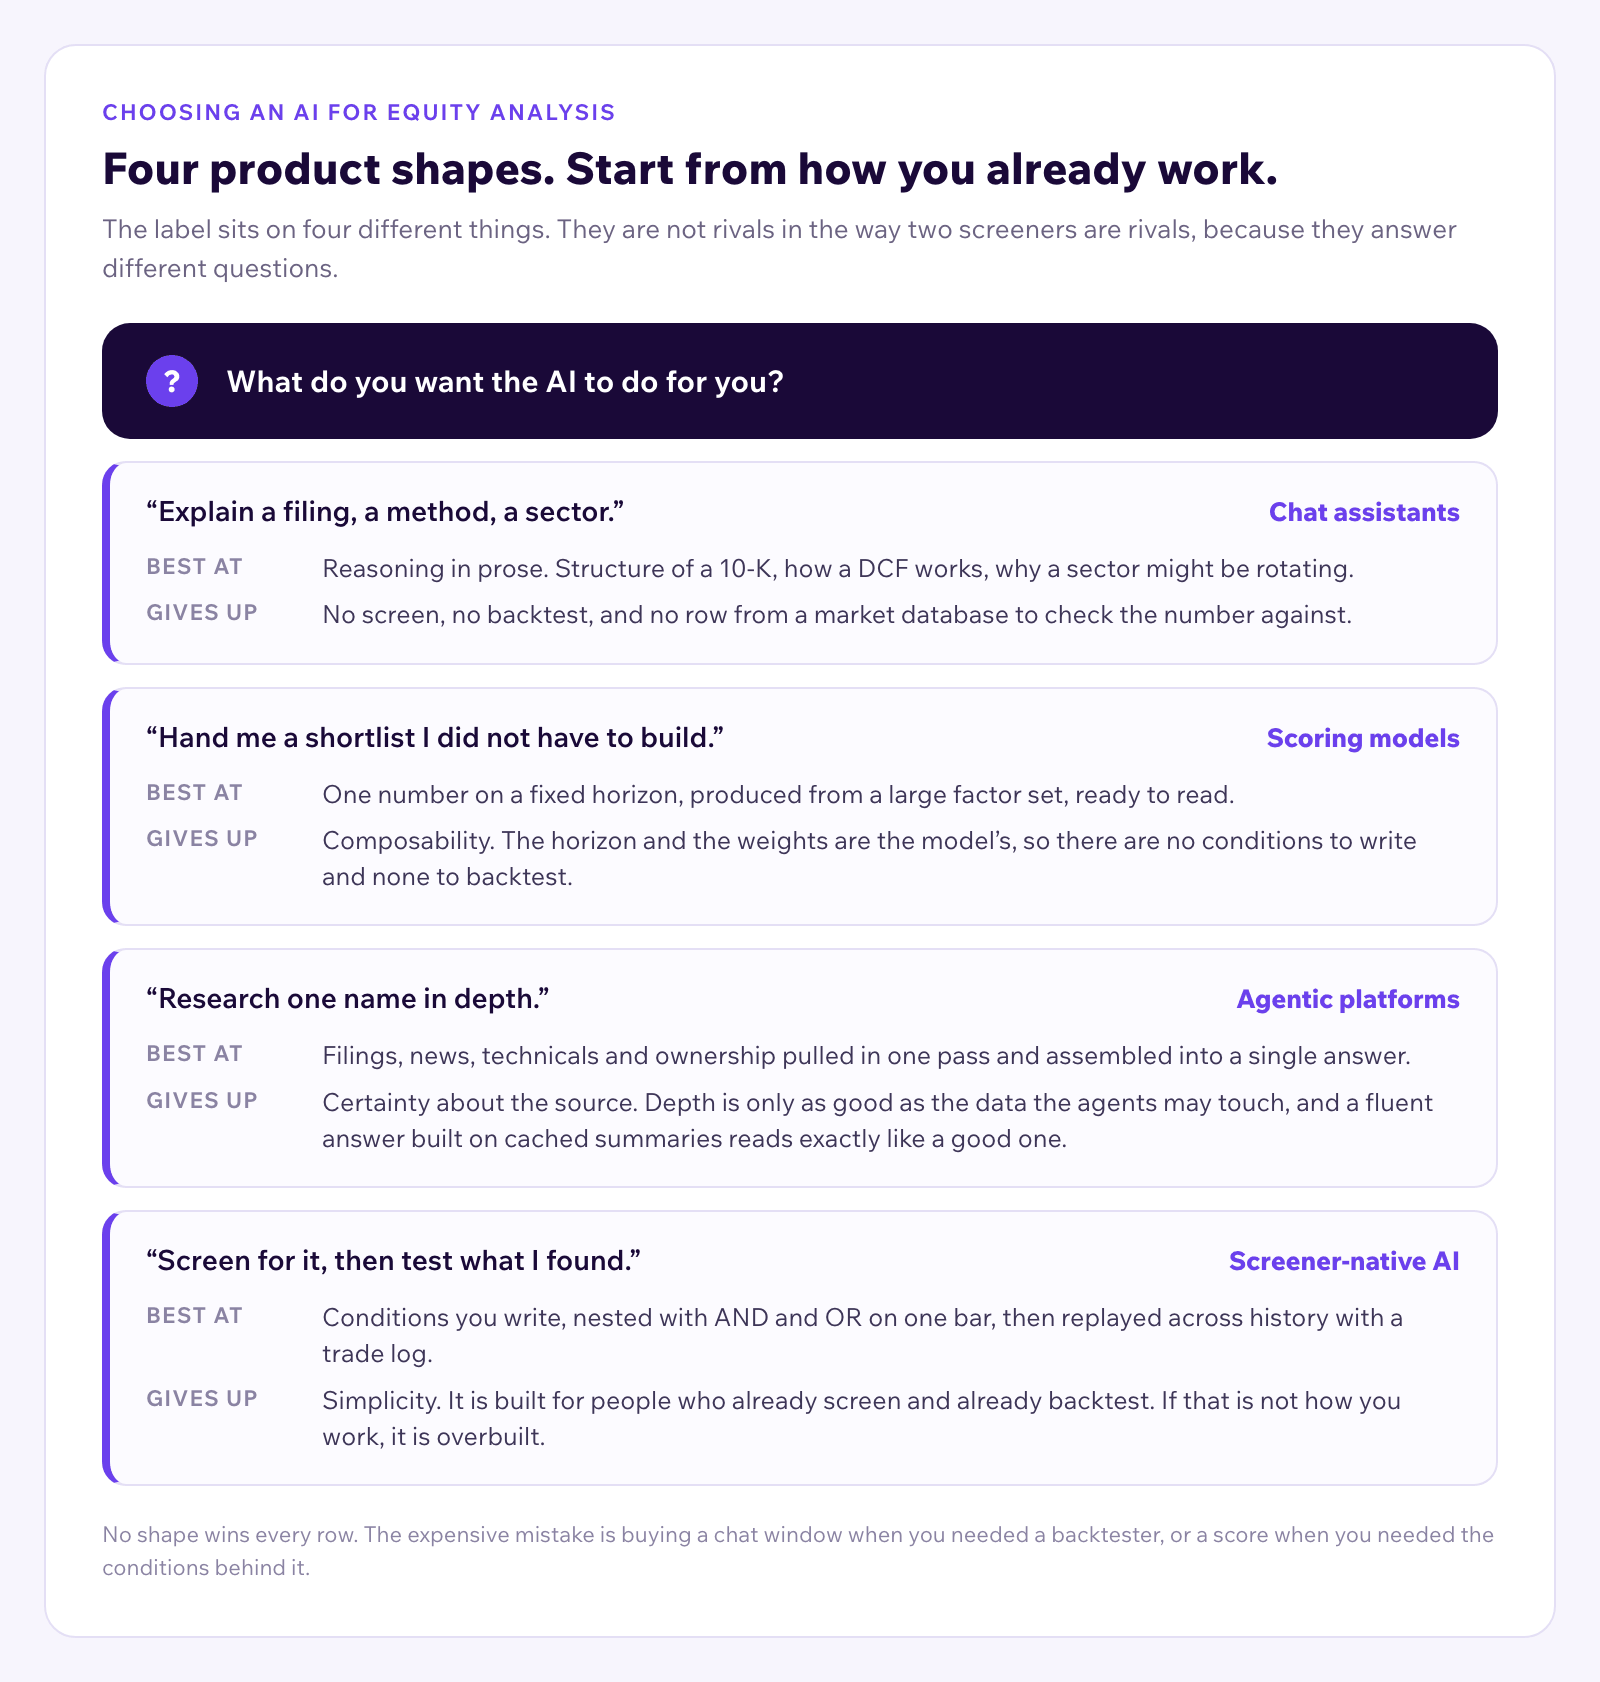
Four product shapes carry the label. They are not competitors in the same sense that two screeners are competitors, because they answer different questions.
Chat based assistants. General purpose language models used for market questions. You ask about a valuation method, a filing, a sector, and you get prose back.
Scoring models. A model reduces a stock to one number on a fixed horizon. The number is the product. You read it, you act on it or you do not.
Agentic research platforms. A coordinator breaks a question into sub-tasks, hands them to specialised agents, and reassembles the results. The appeal is depth: filings, news, technicals and ownership in one pass.
AI attached to a screener and a backtester. The assistant sits in the same workspace as the tools you use to act, so an observation can become a filter and then a historical test without leaving the page.
Most confusion in this market comes from treating those four as interchangeable. A score cannot explain itself in a conversation. A chat window cannot rank a market of several thousand names against conditions you wrote. Knowing which shape you need is the first decision, and it is usually the whole decision.
Four questions separate a useful tool from a good demo.
Can you see the row the number came from?
When a tool tells you insider buying rose last quarter, the useful follow-up is: which filing, on what date, at what price. In the US that data starts life as a Form 4, the Statement of Changes in Beneficial Ownership filed under Section 16(a) of the Securities Exchange Act of 1934. The form carries a checkbox for transactions made under a Rule 10b5-1(c) plan, which means the sale was scheduled in advance rather than decided last week.
That checkbox is the whole point of citations. A tool that reports “insider selling” without letting you reach the filing has given you a headline where the document held the meaning. Transparency here is not a courtesy feature. It is the difference between a claim you can test and a claim you have to trust.
Is the number computed now, or served from a cache?
Relative strength, VWAP and moving averages change while you read them. So does news sentiment. A tool that answers from a snapshot taken at an unknown time can describe a setup that closed an hour ago, and it will describe it confidently. Ask any vendor when the figure behind the answer was calculated. The good ones will tell you.
Can the answer turn into a screen, or a backtest?
An insight that lives in a chat window is half finished. If you have to retype the idea into a different product to act on it, count that friction honestly, because in practice it means most ideas never get tested at all.
What is the allowance, and what does it cost?
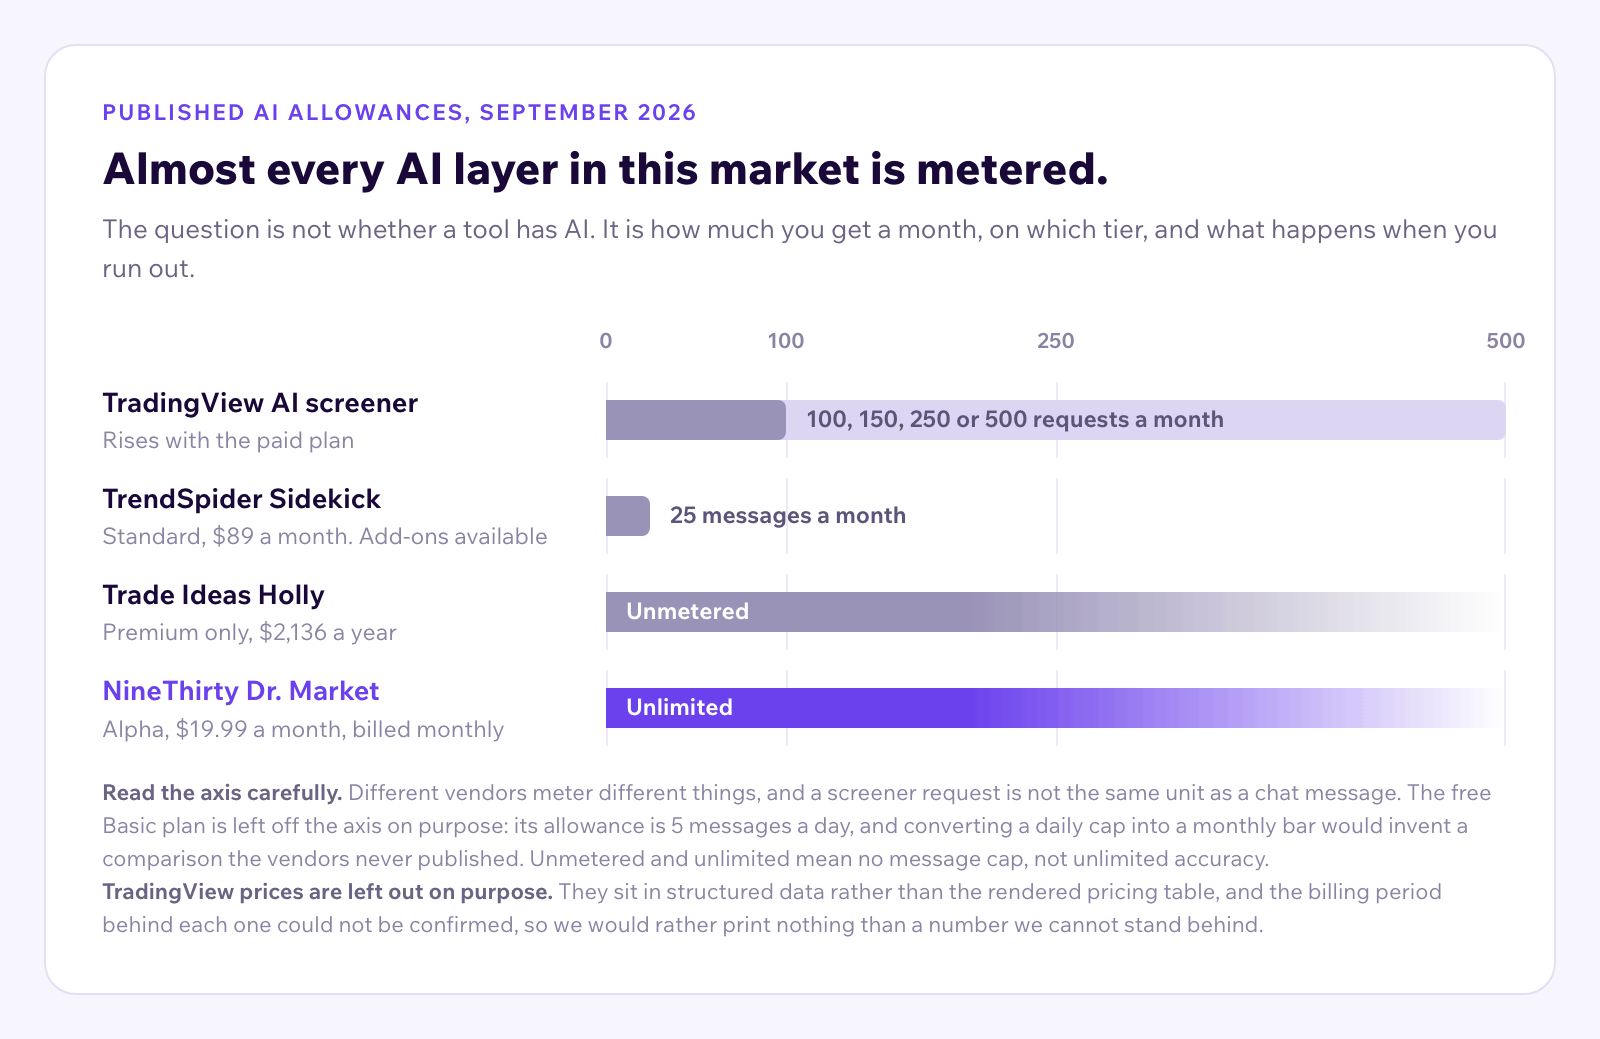
Almost every AI layer in this market is metered. The question is not whether a tool has AI. It is how many questions you get a month, on which tier, and what happens when you run out. That is a number, and vendors publish it. We compare the published ones further down.
Can ChatGPT, Gemini or Perplexity analyse stocks?
They are good at things that are genuinely hard. Explaining how a discounted cash flow model works, walking through the structure of a 10-K, thinking out loud about why a sector might be rotating, summarising a long document into something you can argue with. Several of them now retrieve from the live web, which helps for recent news context. Anyone who tells you these tools are useless has not used them for the work they are good at.
Where they stop, for a trader, is precision and handoff. A general model is not connected to a screener, so it cannot rank a market against conditions you wrote. It is not connected to a backtester, so it cannot tell you how those conditions performed. And it does not cite a row from a market database, so verifying any specific figure means opening another tab and doing the work yourself. That is the failure mode our wedge user already knows: a number that looked right, sounded right, and came from nowhere.
Used as a supplement, they are excellent. Used as the research layer under a trade, they put the verification burden back on you.
Are AI stock scores worth using?
This is the category that most often gets described lazily, including by us. The honest version is more interesting.
Danelfin publishes an AI Score from 1 to 10 that expresses a probability of outperforming an index over the next three months, benchmarked to the S&P 500 Total Return for US names and to the STOXX Europe 600 for European ones. It is built from roughly 10,000 features per stock per day, including over 600 technical, 150 fundamental and 150 sentiment indicators, combined across hundreds of decision trees. There are Fundamental, Technical, Sentiment and Low Risk subscores underneath the headline number. Danelfin also describes its own model as explainable rather than opaque: the features and indicators behind a score are inspectable, and a Scores Explanation panel ranks the signals that drove it. That explainability is tier gated, with lower plans showing only the top alpha signals and higher plans showing all of them, but the claim is real and it is checkable in one click.
TipRanks builds its Smart Score from eight market factors: analyst ratings, corporate insiders, financial bloggers, individual investor sentiment, hedge fund managers, news sentiment, technicals and fundamentals. Eight to ten reads Outperform, four to seven Neutral, one to three Underperform. TipRanks describes the score as data driven with no human intervention. The inputs are published. The weighting is not.
So “black box” is the wrong criticism for at least one of them.
The real limit of a score is composability. Danelfin explains its score, and you still cannot write it. The horizon is fixed at three months, the factor weights are the model’s, and there is no way to say “this, but only when volume is above average and the last earnings report beat”. You also cannot backtest the conditions, because there are no conditions. There is an output.
For an investor who wants a shortlist without building criteria, that is a fair trade and the tools do it well. For a trader whose edge is the specific combination they believe in, a fixed score is a starting point someone else chose.
An agentic system decomposes a question. Ask it about a company and a coordinator dispatches sub-tasks: pull the recent filings, check the news, compute the technicals, look at who has been buying. The results come back and get assembled into one answer. It is closer to how an analyst actually works than a single model pass is.
Two things decide whether the output is worth anything: the data the agents are allowed to touch, and whether they show you what they used. An agentic system reading cached third party summaries produces fluent, confident, unverifiable text. The architecture is not the feature. The data layer under it is.
This category is also not ours alone. TrendSpider ships agentic technical analysis through Sidekick, capped at 25 messages a month on its base plan with add-ons available, on a Standard tier at $89 a month. Trade Ideas runs Holly, which re-simulates strategies nightly and fires entries and exits during the session, on a Premium tier at $2,136 a year. Its output is tagged with a strategy name rather than an explanation, which is a different product decision, not a worse one, and it matters if the thing you want is the reasoning. These are capable products, and anyone claiming the idea is rare in 2026 is behind.
What changes when the AI sits inside the screener?
The handoff is the difference, and it is easy to underrate until you have lost an afternoon to it.
TradingView is the clearest example of the split, and it is worth being fair about why. Its charts and community are the best in the retail market, which is exactly why the AI question comes up there. Its AI screener requests are metered by plan at 100, 150, 250 and 500 a month across the paid tiers. Backtesting is Pine Script: the pricing table lists strategy backtesting, deep backtesting, the Pine Screener and Pine indicators as separate capabilities, and none of them is a backtest of the screen you built. So the AI can help you find something, and validating it is a different skill in a different language.
That gap is the case for the fourth category. When the assistant, the screener and the backtester are one product, the sentence “show me stocks doing this” and the sentence “show me how that did over the last two years” run against the same data on the same bars.
Where Dr. Market fits, and where it does not
Dr. Market is NineThirty’s AI analyst. It is a hierarchical multi-agent system: a coordinator with sub-agents for screening, analysis, financials, metrics, ownership, events, sector views and documents. Its tools fetch financials, news, insider trades, corporate actions and trade setups, and run screener and metrics queries directly. Every answer comes back with clickable references to the page the figure came from, so checking a claim about NVDA or AAPL is a click, not a research project.
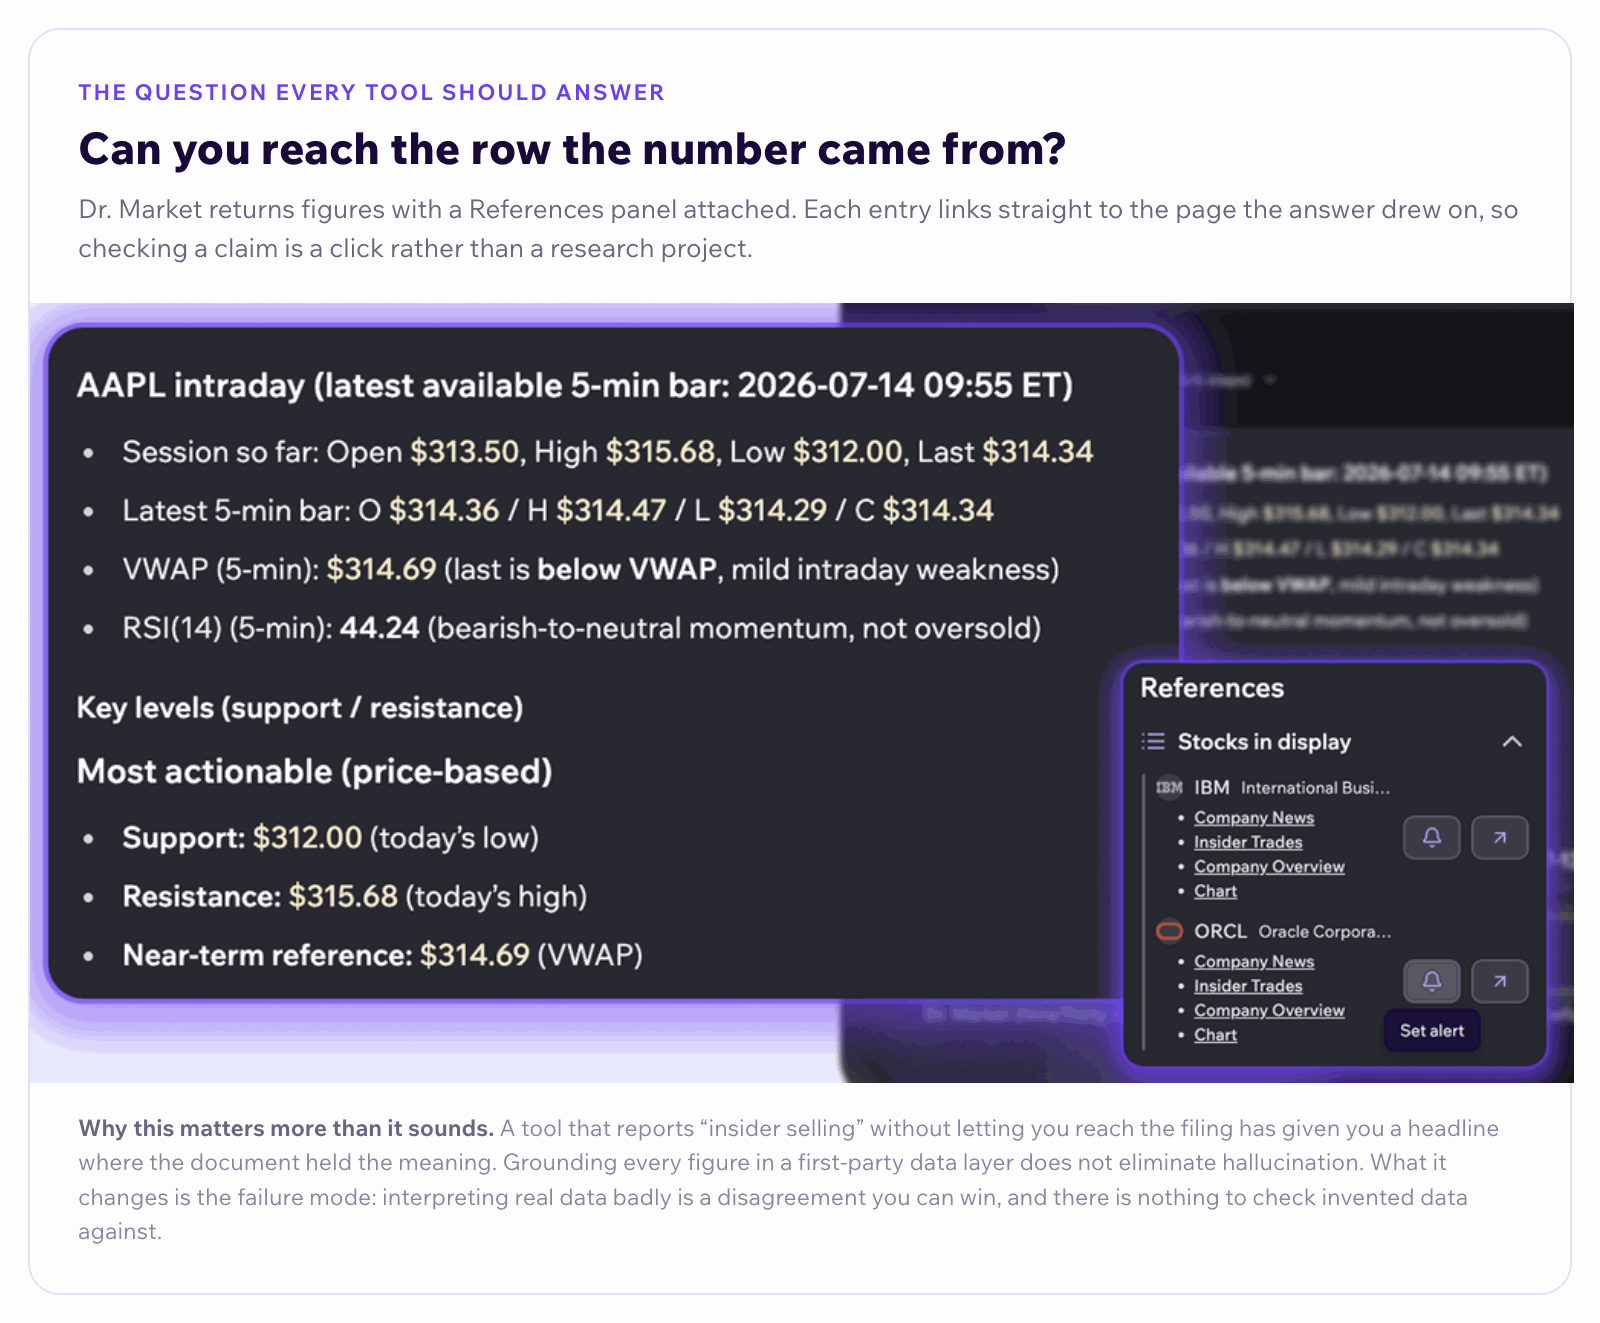
The architectural claim is narrow and worth stating exactly. Dr. Market has no memory to fall back on and no web to search. Every number it uses is handed to it by our data layer. The AI does the reasoning. It never supplies the facts.
What it hands off to is the reason it exists. An observation becomes a filter in the screener, which carries 40+ technical indicators with configurable parameters, 20+ fundamentals across the income statement, cash flow and balance sheet, news filtered by category, sentiment and impact, plus corporate actions, insider deals and support and resistance. Conditions nest with AND and OR, and everything resolves on the same bar. From there the same conditions go into a backtest that replays them across history and reports, per stock, how often the screen triggered, the historical win rate, the average return and which holding period did best, with a trade log carrying MFE and MAE on every occurrence.
Trading involves risk of loss. Backtested performance is hypothetical, does not reflect actual trading, and does not indicate future results.
Now the parts people find out later, which belong here instead.
Coverage is US only. US equities and ETFs on NYSE and Nasdaq, roughly 5,800 company pages live. If you trade outside that, this is the wrong tool and no feature list changes it.
The depth is tiered. On the free Basic plan, Dr. Market answers 5 messages a day, you keep 1 saved screen, you get 2 backtest runs a day, history goes back 50 candles, and there are no custom interval candles at all. Alpha at $19.99 a month, billed monthly, lifts Dr. Market and saved screens and backtests to unlimited, history to 500 candles, and adds hourly and minute candles, insider deal screening down to daily, news screening down to hourly, and 50 active alerts. Anyone quoting “minute level data” or “500 candles” as a flat platform capability is quoting the paid tier. The current split is on the pricing page.
It does not recommend. Dr. Market analyses. It is not a broker and not an investment adviser, it knows nothing about your portfolio, your timeline or your risk tolerance, and it will not tell you what to buy.
The limit worth saying out loud
Grounding every figure in a first-party data layer does not eliminate hallucination. Nothing does yet, and anyone telling you otherwise is selling something.
What it changes is the failure mode. When Dr. Market gets something wrong, we want it to be interpreting real data badly rather than inventing data. The first is a disagreement you can have with it, and win. The second is a trap, because there is nothing to check it against.
That is the whole bet, and it is the right question to put to every tool in this post, ours included. Not “is it ever wrong”, because it is. But “when it is wrong, can I find out?”
How the four approaches compare
| Chat assistants | Scoring models | Agentic platforms | Screener-native AI |
|---|
| Cites the source row | No | Varies. Danelfin explains its factors, tier gated. TipRanks publishes its inputs, not the weighting | Varies by platform | Clickable reference on every figure |
| Computes the indicator on request | No | No, fixed model output | Varies | Yes, from a first-party data layer |
| You write the conditions | No | No, the horizon and weights are the model’s | Rarely | Yes, nested AND and OR on one bar |
| Backtests those conditions | No | No | Rarely | Yes, per stock, with a trade log |
| Sub-daily timeframes | No | No | Varies | Hourly and minute candles on the paid tier |
| Best for | Concepts, filings, sector reasoning | A shortlist you did not have to build | Deep research on one name | Screening, validating and monitoring a setup you defined |
No column wins every row, and the last one is narrower than it looks: it is built for people who already screen and already backtest. If that is not how you work, a scoring model will serve you better for less effort.
What does the AI layer actually cost?
Published allowances, checked against each vendor’s own pages in September 2026.
| Product | The AI allowance | Tier |
|---|
| TradingView | 100, 150, 250 or 500 AI screener requests a month | Rises with the paid plan |
| TrendSpider Sidekick | 25 messages a month, add-ons available | Standard, $89 a month |
| Trade Ideas Holly | Unmetered | Premium only, $2,136 a year |
| NineThirty Dr. Market | 5 messages a day | Basic, free |
| NineThirty Dr. Market | Unlimited | Alpha, $19.99 a month |
Two honest notes on that table. TradingView’s published plan prices sit in structured data rather than the rendered pricing table, and the billing period behind each one was not confirmed, so we have left its prices out rather than print a number we cannot stand behind. And unlimited on our side means unmetered messages, not unlimited accuracy.
What should you ask before you pay for one?
Five questions, in the order that saves the most money.
How do I work now? If you do not screen and do not backtest, the integrated category is overbuilt for you and a scoring model is a better fit.
Can I reach the underlying row? Ask for a citation on a specific figure during the trial. If the answer is a conclusion with no path back to the data, you are being asked to trust rather than check.
When was this number computed? Particularly for anything intraday.
What is metered, and what happens at the cap? Message counts, backtest runs, saved screens and candle history are the four that usually bite.
What does it replace? An assistant bundled with a screener, a news feed, an events calendar and sector heatmaps is a different purchase from three subscriptions that do not talk to each other.
The best AI for equity analysis is not a product, it is a match. The tools in this post are mostly good at what they were built for. The expensive mistake is buying a chat window when you needed a backtester, or a score when you needed the conditions behind it.
DISCLAIMER: This article is for educational and informational purposes only. It does not constitute investment advice or a research report.