Most traders who struggle with swing screening do not have a data problem. They have an ordering problem. They stack fifteen conditions, get three results, and decide the screener is broken. Or they run something loose, pull eight hundred tickers, and spend the afternoon sorting noise that was never going to become a trade.
Fewer conditions, applied in the right order, with the catalyst check in the place it actually belongs. That is the method. The order matters more than the conditions do.
Why most swing trading screens fail before you place a trade
The usual problem is not the screener. It is the filter logic.
Swing traders borrow criteria from the wrong playbooks. Day trader filters are built for intraday price action. Long-term investor filters are built around valuation ratios and dividend yield. Neither set was designed for a three to ten day hold, which is where most swing setups live.
The second problem is fragmentation. You screen for a pattern on one tab, check a separate earnings calendar for catalyst risk, pull up a news feed to see what broke overnight, then visit a filings site to see whether management has been buying. By the time you have done that for twenty tickers, the setup you liked at 9:45 has already moved.
Effective swing screening is not about more data. It is about the right data in one place, applied in a sequence.
Swing trading sits between the two types of trading you are copying from
It helps to be blunt about what a three to ten day hold actually needs.
A day trader cares about the first thirty minutes, the opening range, and the tape. Their filters address the current session, and most of them go stale by lunch. An investor cares about the next three years. Their filters address the balance sheet, and most of them will not move for a quarter.
A swing trader needs something in between: a trend that is intact on a slower chart, a trigger that fired on the daily, enough liquidity to get out at a sane price, and no scheduled event inside the hold that makes the chart irrelevant. Four things. Not fifteen.
That is why the filter count usually goes wrong. Traders take four day-trading conditions and four investing conditions, add them together, and end up with eight conditions that contradict each other.
The right order: universe first, setup second, catalyst third
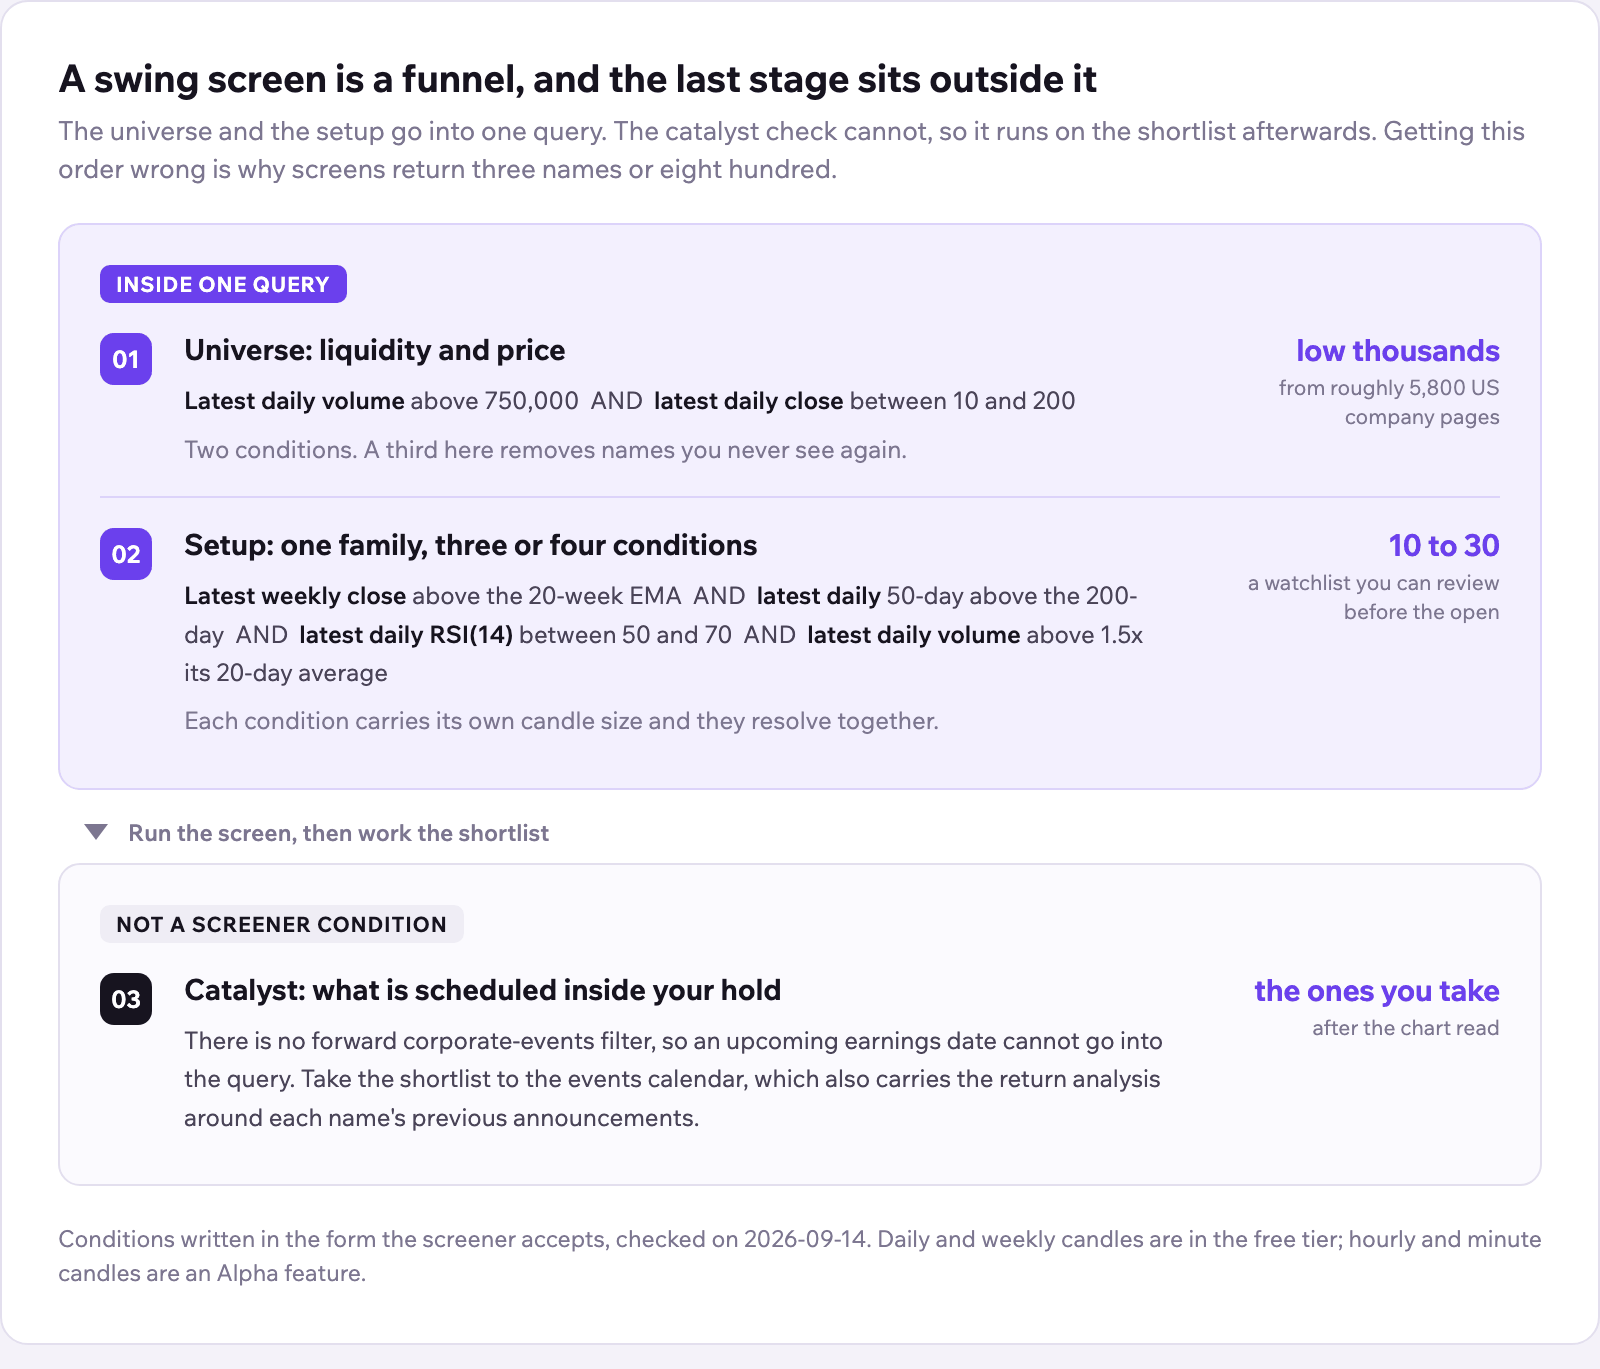
Think of a swing screen as a three-stage funnel, not a single wall of filters.
Stage one: define the universe
Before you touch an indicator, cut the universe on liquidity and price. In the NineThirty screener that is two conditions:
- Latest daily volume above a floor you set, commonly 500,000 or 750,000 shares. Thin books eat the edge through the spread.
- Latest daily close inside a price range that fits your position sizing. Many traders exclude anything under five dollars unless there is a specific reason to be there.
US coverage is NYSE and Nasdaq equities and ETFs, roughly 5,800 company pages. Two liquidity conditions typically cut that to a working universe in the low thousands. You can see the starting point on the all stocks list before you filter anything.
Resist the urge to add a third universe condition here. Every one you add at this stage removes names you will never see again.
Stage two: find the setup
Now the technical conditions. Most swing setups belong to one of two families, and mixing them is the single most common way to get zero results.
Continuation. Price is trending and you are joining it. The 50-day average above the 200-day average, price above both, momentum above the midpoint. This is the golden cross stock idea, expressed as a state rather than an event.
Mean reversion. Price has stretched away from its own average and you are betting it comes back. A mean reversion trading strategy wants the opposite conditions: price below the 20-day average, RSI in the lower band, in a name whose longer trend is still up.
Pick one family per screen. A screen asking for RSI above 50 and RSI below 30 returns nothing, and the screener is not at fault.
Keep it to three or four conditions. A fifth usually removes good setups rather than bad ones. Conditions nest with AND and OR, and every condition carries its own candle size, so a weekly trend condition and a daily momentum condition resolve together in one query instead of across three separate result lists.
Stage three: check the catalyst, after the screen runs
This is the stage most guides get wrong, including by telling you to screen for it.
A technically clean setup with earnings two days out is a different trade from the same setup without. You might still take it, but you need to know. The same goes for Federal Reserve decisions, ex-dividend dates and corporate actions.
Upcoming earnings dates are not a screener condition. There is no forward corporate-events filter, so “no earnings in the next five sessions” cannot go into the query. Run the screen, then take the shortlist to the events calendar, which also carries return analysis around each name’s previous announcements. That second part is the useful half. It tells you how the stock has actually behaved into and out of its own reports, rather than just showing you a date.
Anyone who tells you the catalyst check is a filter has not built the screen.
Match the indicator timeframe to the length of the hold
A three to ten day hold has a natural resolution, and most screens are set outside it.
Weekly candles give trend context. On a ten-day hold you get two of them, so a weekly condition is a filter on the regime, not a trigger. Daily candles are where the trigger lives, because a ten-day hold contains about ten of them and each one carries real information. Hourly and minute candles are noise at this horizon. Sixty-five hourly bars inside a two-week trade will generate a dozen crossings that all reverse.
The practical rule: confirm on the weekly, trigger on the daily, and leave the intraday alone unless you are timing the entry after the screen has already chosen the name.
Custom candle intervals go from minutes upward, and each condition in the same query can use a different one. Daily and weekly are in the free tier. Hourly and minute candles are an Alpha feature, which for swing work matters less than you would think.
What volume means in a swing screen
Volume is the condition traders most often include and least often think about.
On its own, a raw volume floor is a liquidity filter and nothing more. It says you can get in and out. It says nothing about the setup.
Volume becomes informative when you compare it to the name’s own recent history. Today’s volume against its twenty-day average is the standard form. A reading well above that average says something changed, and the price direction on that bar tells you which way. This is why volume indicators are usually paired with a price condition rather than read alone. Volume up and price up is participation. Volume up and price down is distribution. The same number, two opposite readings.
For a swing entry, one useful construction is a volume expansion on the trigger bar after a run of quiet sessions. The quiet part tells you the name was ignored. The expansion tells you it stopped being ignored.
What the screener will not express, and what to do instead
Every condition in the screener addresses the latest bar of a given candle size, compared against a value or another indicator. That grammar is broad, and it has edges. Knowing where they are saves an hour.
RSI divergence. Divergence compares two points in time on two series at once: price made a higher high while RSI made a lower high. Price fields do reach back a bar, so latest daily close above the previous day high is a real condition, and a useful one for a swing entry. An indicator’s own earlier value is not addressable the same way, so divergence has no condition form. Screen for RSI in the zone you want, then read the divergence off the chart on the shortlist. It works as a confirmation step, not a filter.
Crossovers in the last N sessions. “RSI crossed above 50 in the last three sessions” is an event spread across bars, and it needs the indicator’s reading on each of them. Express the state instead. Latest daily RSI above 50 is the part the screen carries, and the chart read on the shortlist tells you how recently it got there.
Relative strength against an index. You can point a whole screen at an index universe, but that chooses which stocks are eligible. A condition comparing one stock’s return to the index return is a different thing and is not available. Compare a stock to its sector instead, using sector-weighted average valuation or the sector heatmap.
Earnings surprise history and debt load. Fundamentals cover income statement, cash flow and balance sheet. Check the specific field exists before you design a screen around it rather than assuming.
How many stocks should a swing screen return
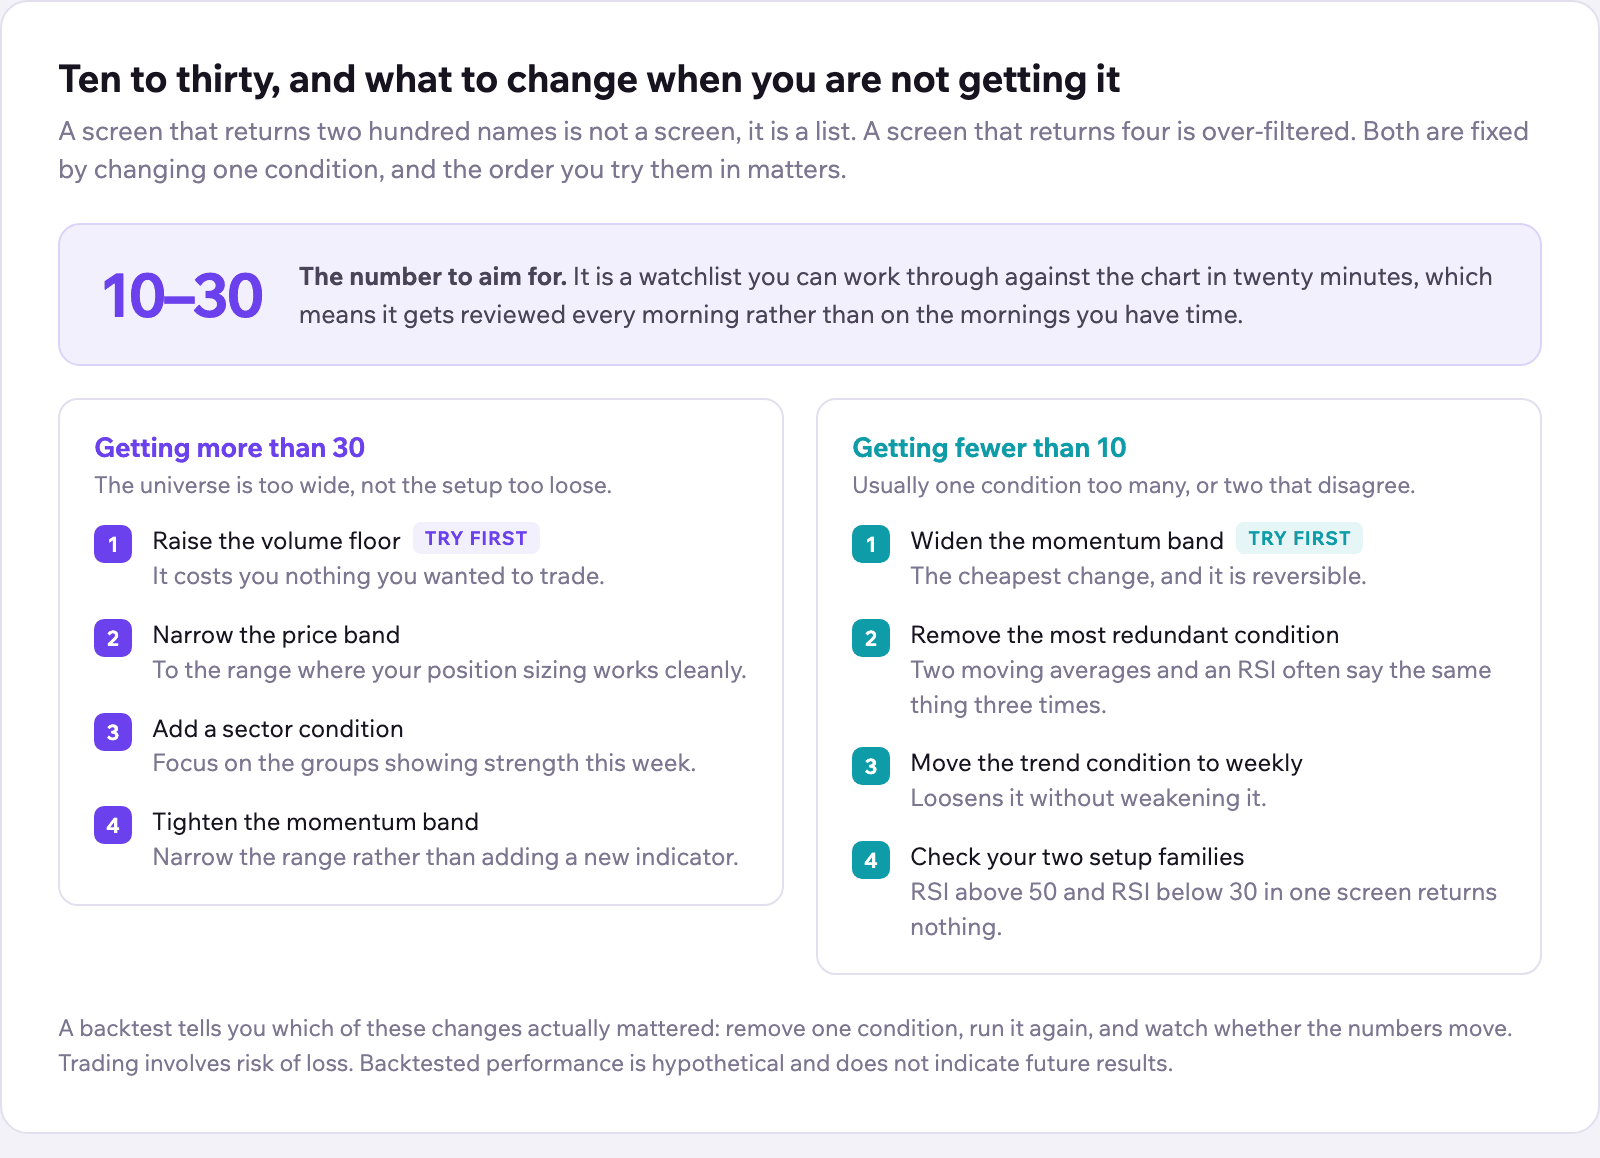
Between ten and thirty candidates. That is the number you can actually review against a chart before the open.
If you consistently get more than thirty:
- Raise the volume floor. This is almost always the right first move, and it costs you nothing you wanted.
- Narrow the price band to the range where your position sizing works cleanly.
- Add a sector condition and focus on the groups showing strength this week.
- Tighten the momentum band rather than adding a new indicator.
If you consistently get fewer than ten:
- Widen the momentum band before anything else.
- Remove one technical condition, usually the most redundant one. Two moving-average conditions and an RSI condition often say the same thing three times.
- Move the trend condition from daily to weekly, which loosens it without weakening it.
- Check that your two setup families have not ended up in the same screen.
A watchlist you can work through in twenty minutes gets reviewed every morning. A watchlist of two hundred gets reviewed once.
Test the screen before you trade it
Building the screen is the first step. Knowing how the conditions behaved historically is the second, and most traders skip it.
Backtesting runs on the saved screen itself, using the conditions you already built, with no separate strategy language to learn. It reports, per stock, how often the screen triggered, the historical win rate, the average return and which holding period performed best, with a trade log covering every occurrence.
The more useful run is the second one. Remove a single condition, run it again, and see whether the numbers move. If they do not, that condition was decoration and it was costing you results. Free accounts get two backtest runs a day against 50 candles of history, which is enough to test the idea. Alpha lifts both.
Trading involves risk of loss. Backtested performance is hypothetical, does not reflect actual trading, and does not indicate future results.
Where seasonality and insider buying fit
Both are tiebreakers. Neither is a reason.
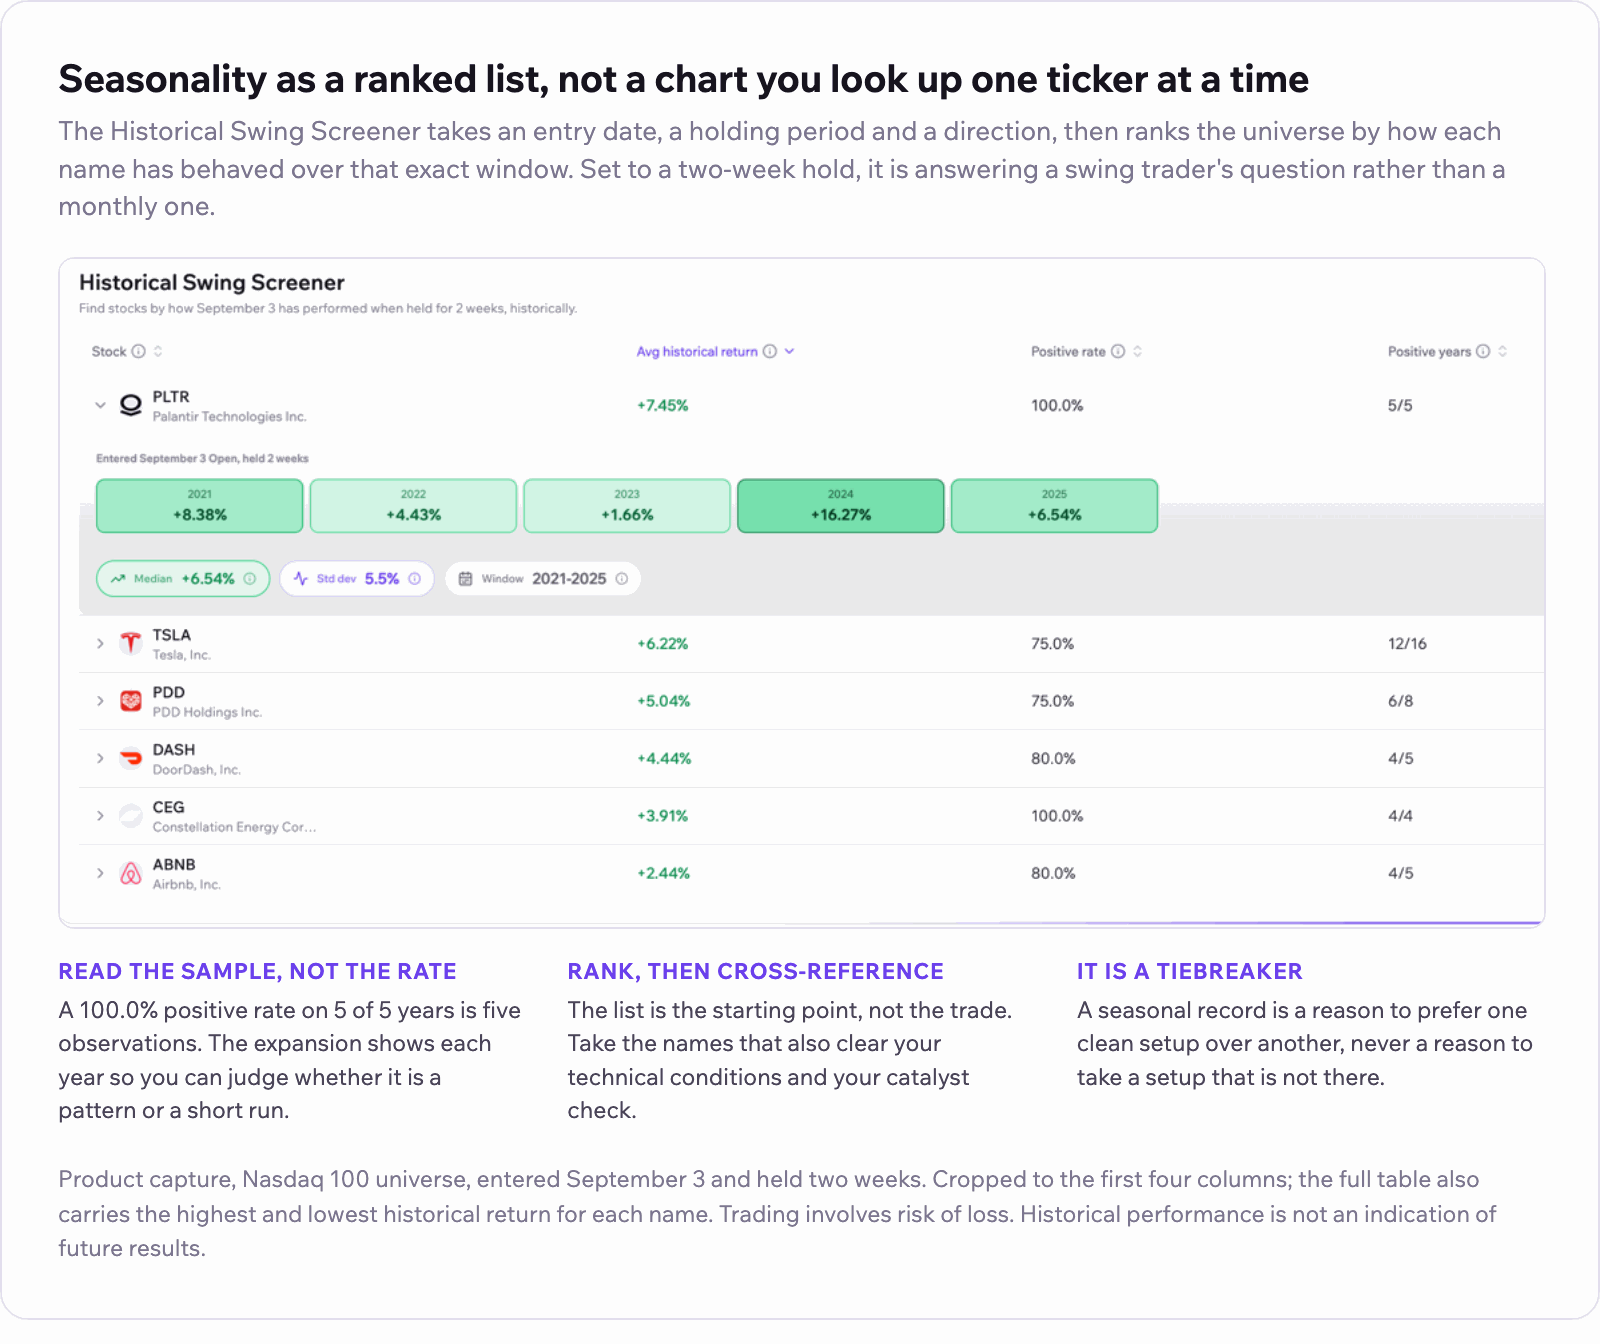
The Historical Swing Screener ranks names by average return and hit rate for an entry date, a holding period and a direction you set, computed on each instrument’s own price history. Set it to a two-week hold and it is answering a swing trader’s question directly rather than showing a monthly chart you have to interpret. Point it at a universe such as the Nasdaq 100, which Nasdaq defines as 100 of the largest non-financial companies listed on its market, and you get a ranked list rather than one ticker at a time. Our seasonality post covers how to read those numbers without fooling yourself, and the short version is that a 100% hit rate across five years is five observations, not a pattern.
Insider buying is the other one. Directors, officers and holders of more than ten percent of a class of equity are Section 16 insiders, and the SEC requires them to report most transactions within two business days. That speed is what makes the data usable on a swing horizon. Insider deals are screenable as acquisitions or disposals over an interval, so insider acquisitions inside the last month can sit in the same expression as your moving-average condition. An acquisition can also be a grant, an option exercise or a gift, so open the Form 4 and confirm an open-market purchase before you count it. A monthly interval is in the free tier. Weekly and daily intervals are Alpha.
News works the same way. Rather than a feed you read, news is a condition: count of items by category, sentiment and impact over an interval, composable with everything else. A clean chart with a week of negative headlines carries risk the chart is not showing you. The news screen is where that lives.
A worked swing screen, end to end
A continuation long, stated the way the screener takes it:
- Universe. Latest daily volume above 750,000. Latest daily close between 10 and 200.
- Weekly trend. Latest weekly close above the 20-week exponential moving average.
- Daily trend. Latest daily 50-day average above the 200-day average, and latest daily close above the 50-day.
- Daily momentum. Latest daily RSI(14) above 50 and below 70. Above 70 you are buying the move, not the setup.
- Daily participation. Latest daily volume above 1.5 times the 20-day average volume.
- Sentiment context. At least one positive-sentiment news item in the last week, and no high-impact negative item.
- Confirmation. At least one insider buy in the last month. Optional, and it will thin the list hard.
Save it. Backtest it. Then run it, take the ten to thirty names it returns, and do the three things the screen cannot do: read each chart, check the events calendar for anything inside your hold, and check the seasonal record for your entry date.
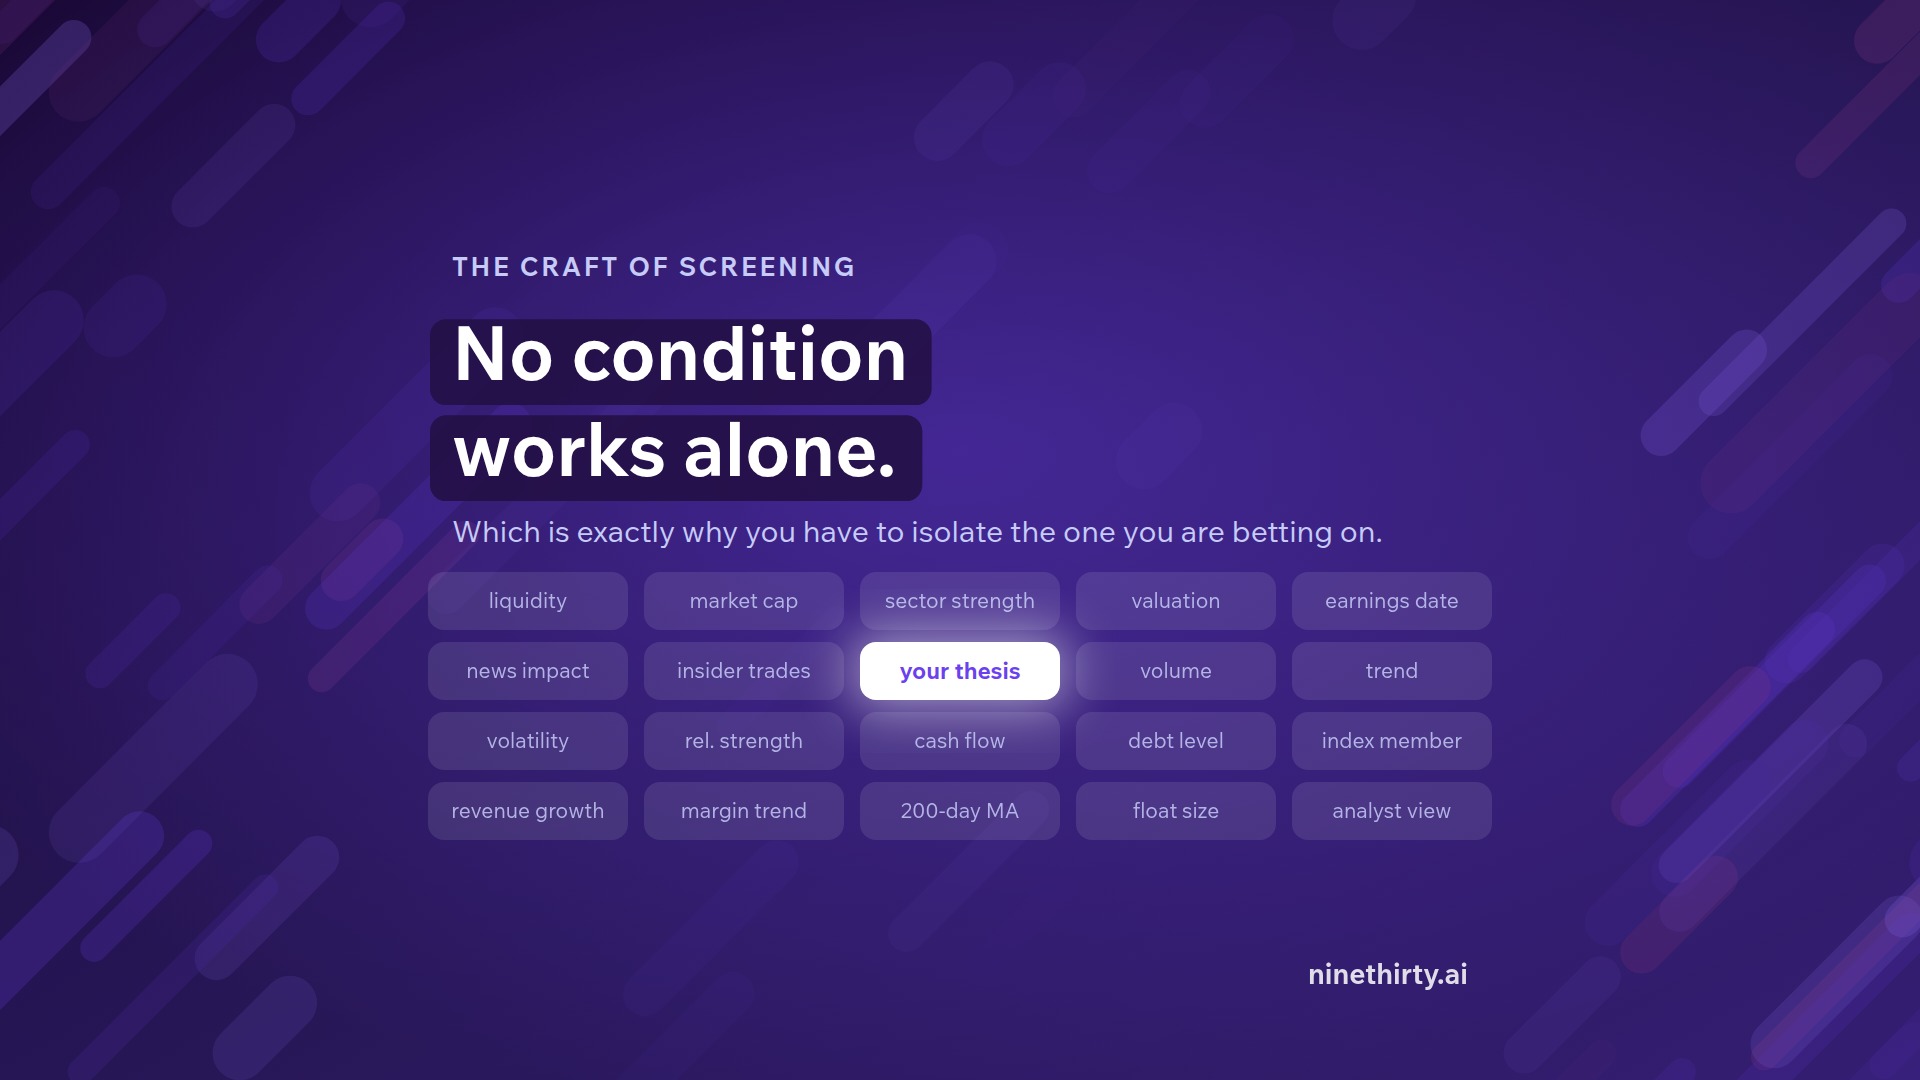
If you would rather ask than build, Dr. Market will assemble the screen from a plain-English description and hand you back the conditions with references to the pages they came from. You can open it and edit every parameter yourself. Our post on building a screening strategy makes the same argument from the other direction: no condition works alone, and the funnel is what makes a list of conditions into a process.
Build the process, not the filter list
Learning how to screen stocks for swing trading is less about finding the right set of filters and more about building something you repeat every morning. The universe stage decides what you can trade. The setup stage decides what you are looking for. The catalyst stage, run after the screen and not inside it, decides whether today is the day.
Backtesting tells you whether the logic held up. Seasonality and insider activity break ties. None of it replaces the chart read at the end.
If your current process needs five tabs and forty-five minutes of reconciliation before you have a watchlist, the problem is not your criteria. It is the friction. NineThirty puts screening, backtesting, the events calendar, news, insider activity and seasonality in one workspace for US equities and ETFs, and a free tier is available.
It analyses. It does not recommend.
DISCLAIMER: This article is for educational and informational purposes only. It does not constitute investment advice or a research report.