Finding a breakout after it has happened is the most expensive way to trade one. By the time a stock clears resistance on heavy volume, the entry you wanted is three percent behind you and the stop you wanted is nowhere sensible.
The setup was visible before that. Range narrowing, volume drying up, a catalyst already on the calendar. What is usually missing is not the information. It is a single place to state all of it as one condition.
This post covers what a pre-breakout stock looks like, which parts of it you can screen for, which parts you cannot, and how to test the screen before you trade it.
Why Most Traders Find a Breakout After It Happens
The common workflow runs backwards. You scan the movers list after the close, see a name up eight percent, then reconstruct the reason.
The reason was usually in three different tabs. Earnings date on a calendar page. Volume expansion on a chart. An insider purchase in a filings feed. Each one is visible. None of them is joined to the others, so nothing fires until price does the joining for you.
That fragmentation is the actual problem. A screen that holds compression, volume and a catalyst in one expression is the fix, and most of this post is about building one.
What Does a Stock Look Like Before It Breaks Out?
Expansion follows contraction. That structure is what a pre-breakout screen is looking for.
The Volatility Contraction Pattern: The Range Narrows
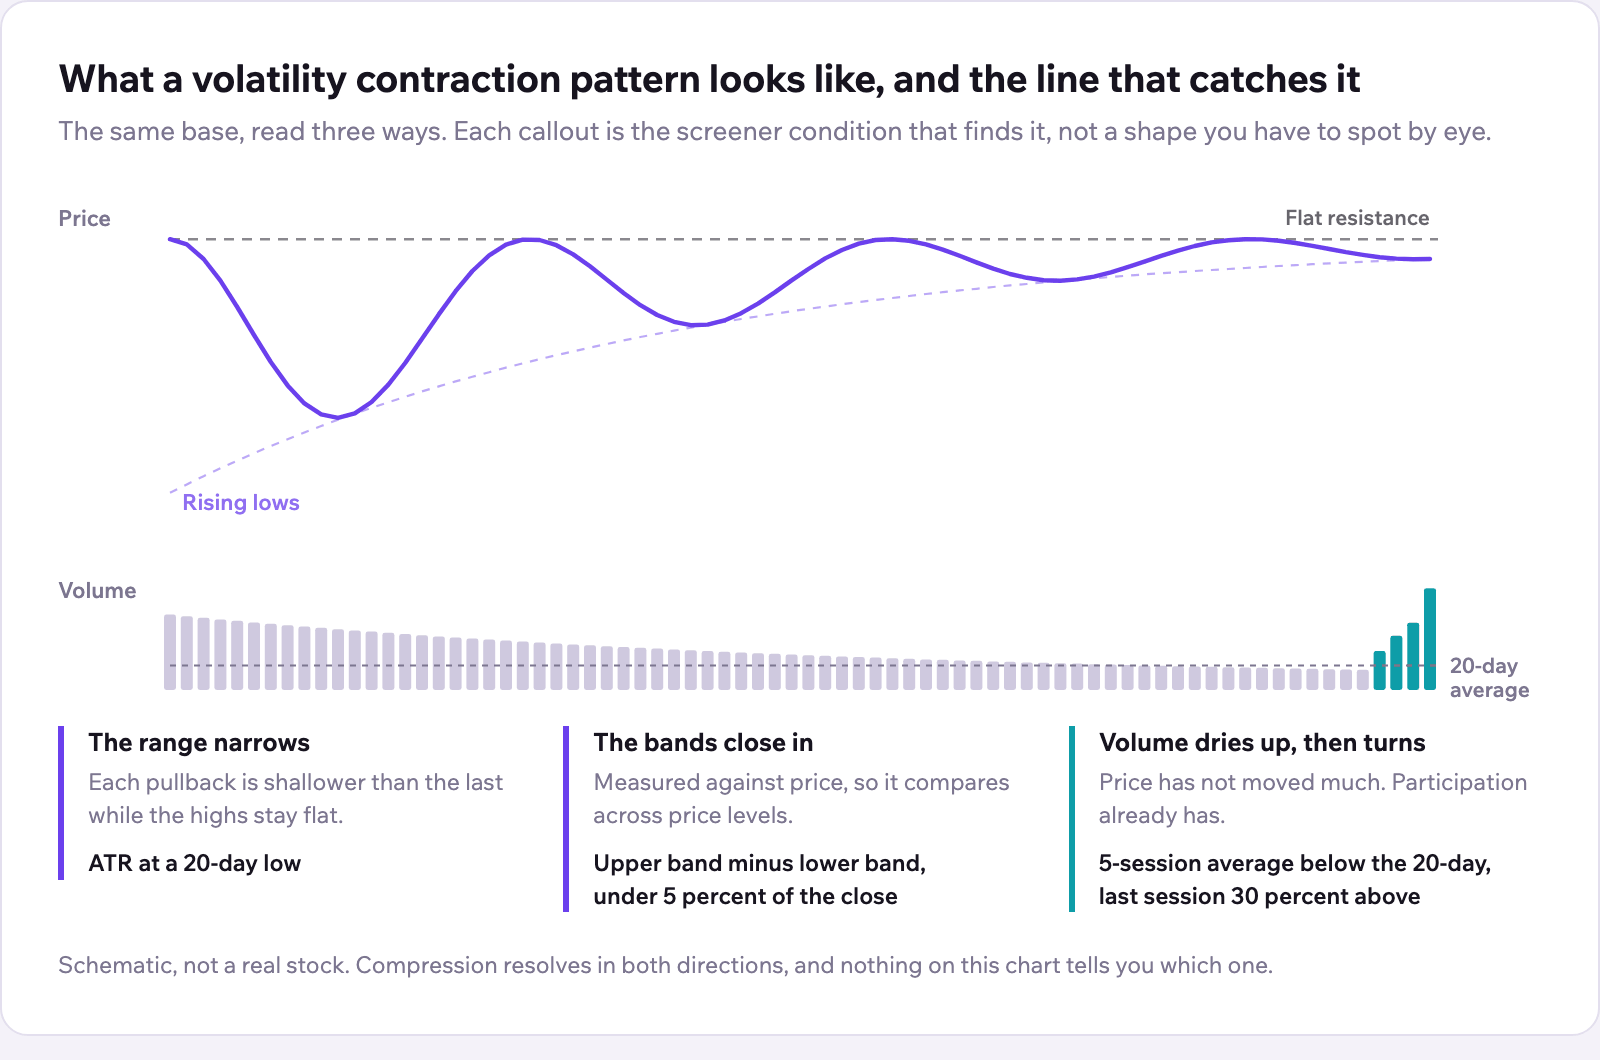
Reliable setups form after the range tightens. Traders call the general shape a volatility contraction pattern, or VCP: a series of pullbacks, each one shallower than the last, on falling volume. A flat base, a bull flag pattern, a wedge and a symmetrical triangle pattern are all versions of it. They share one measurable property, which is falling volatility while price holds a level of support.
Two ways to state it as a condition. Average True Range at a multi-week low while price stays above the 50-day average is the direct version. Bollinger Band width is the other, written as the gap between the upper and lower band measured against price, so a band gap under five percent of the close reads as a tight band rather than a tight band on a cheap stock.
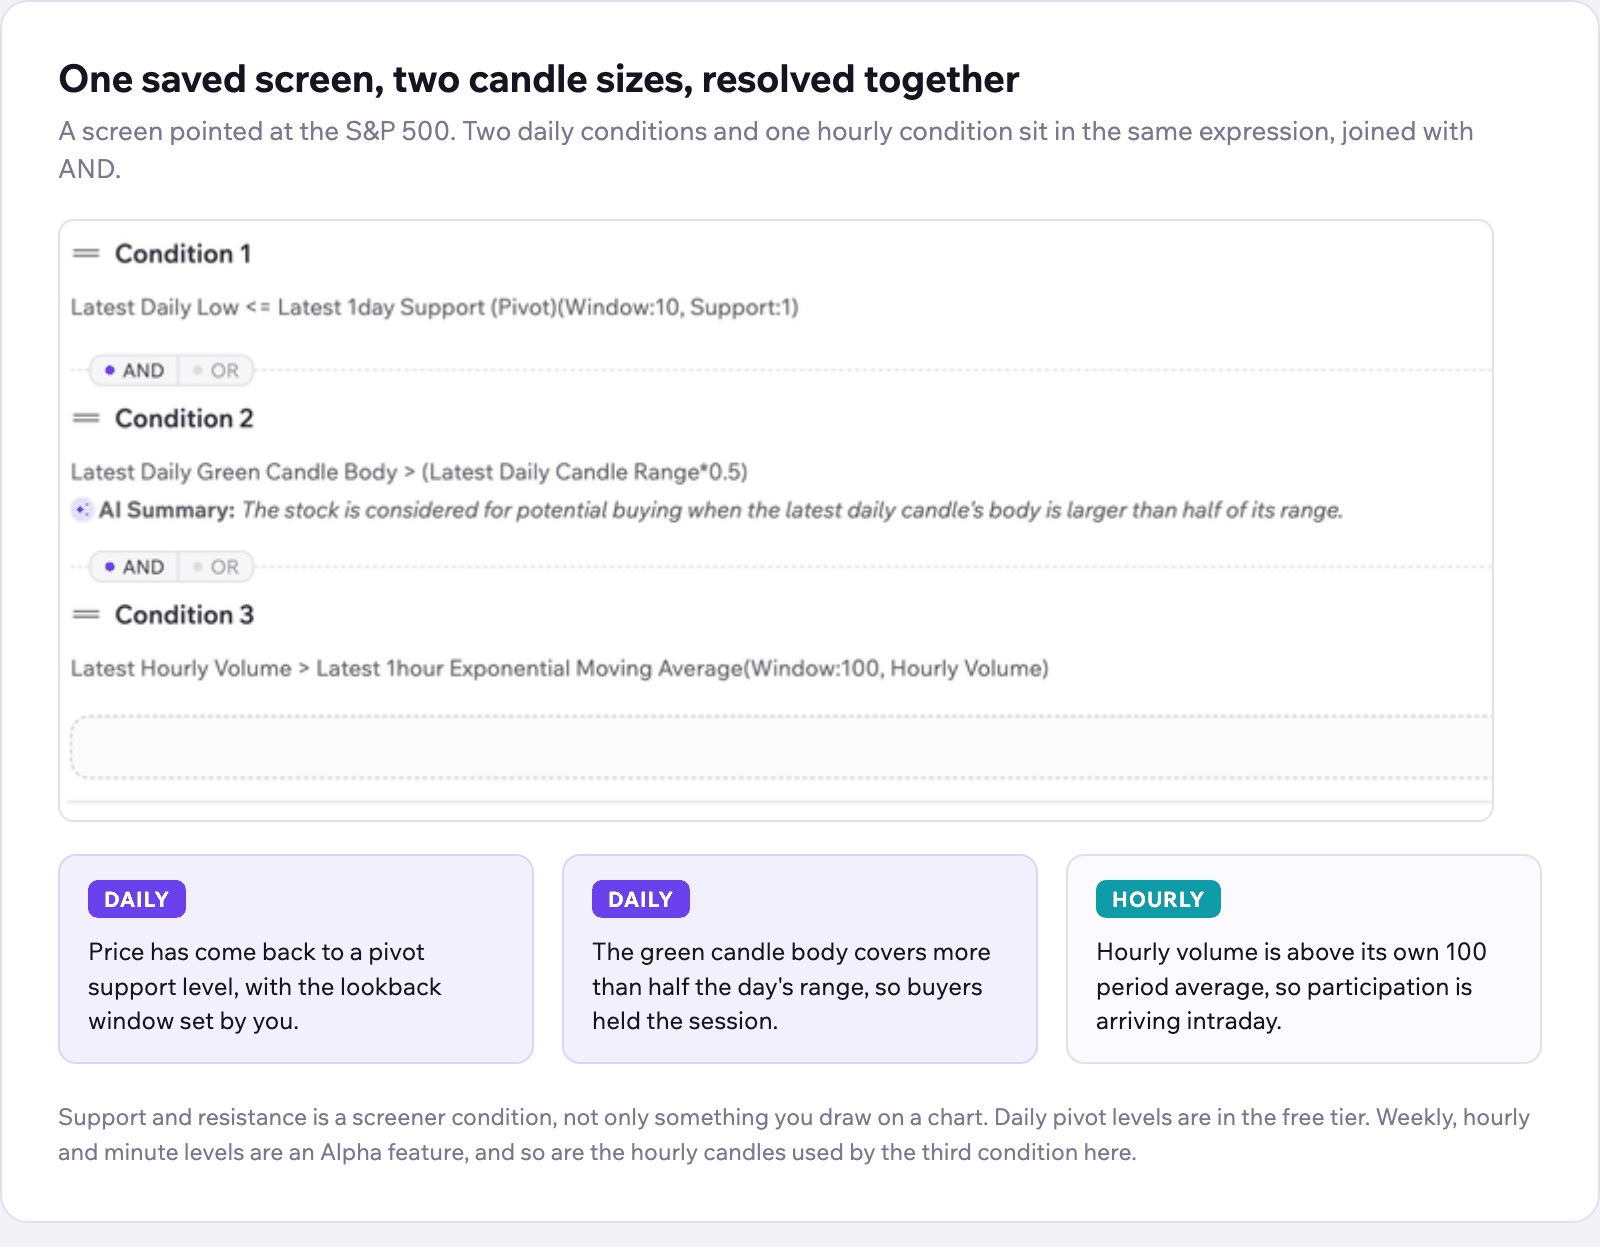
Both are screenable, which means you are not scrolling through charts to find them. Support and resistance is screenable as well, as pivot levels with a lookback window you set, so a condition such as the latest daily low at or under the current support level goes into the same screen as the contraction. Daily levels are in the free tier. Weekly, hourly and minute levels are an Alpha feature.
Volume Dries Up, Then Turns
Volume tells you who is still in the name. Through a base it usually falls, as holders with no thesis leave and the stock digests an earlier move. Volume often starts expanding before price does anything obvious.
Most volume indicators are a single line on a chart. The condition that catches a base is a pair of tests, not one: average volume over the last five sessions below the 20-day average, and the most recent session at least 30 percent above that same average. Price has not moved much. Participation already has.
Relative Strength: It Holds Up Better Than Its Sector
Relative strength is the plain idea that a stock which barely falls while its sector falls is telling you something about demand.
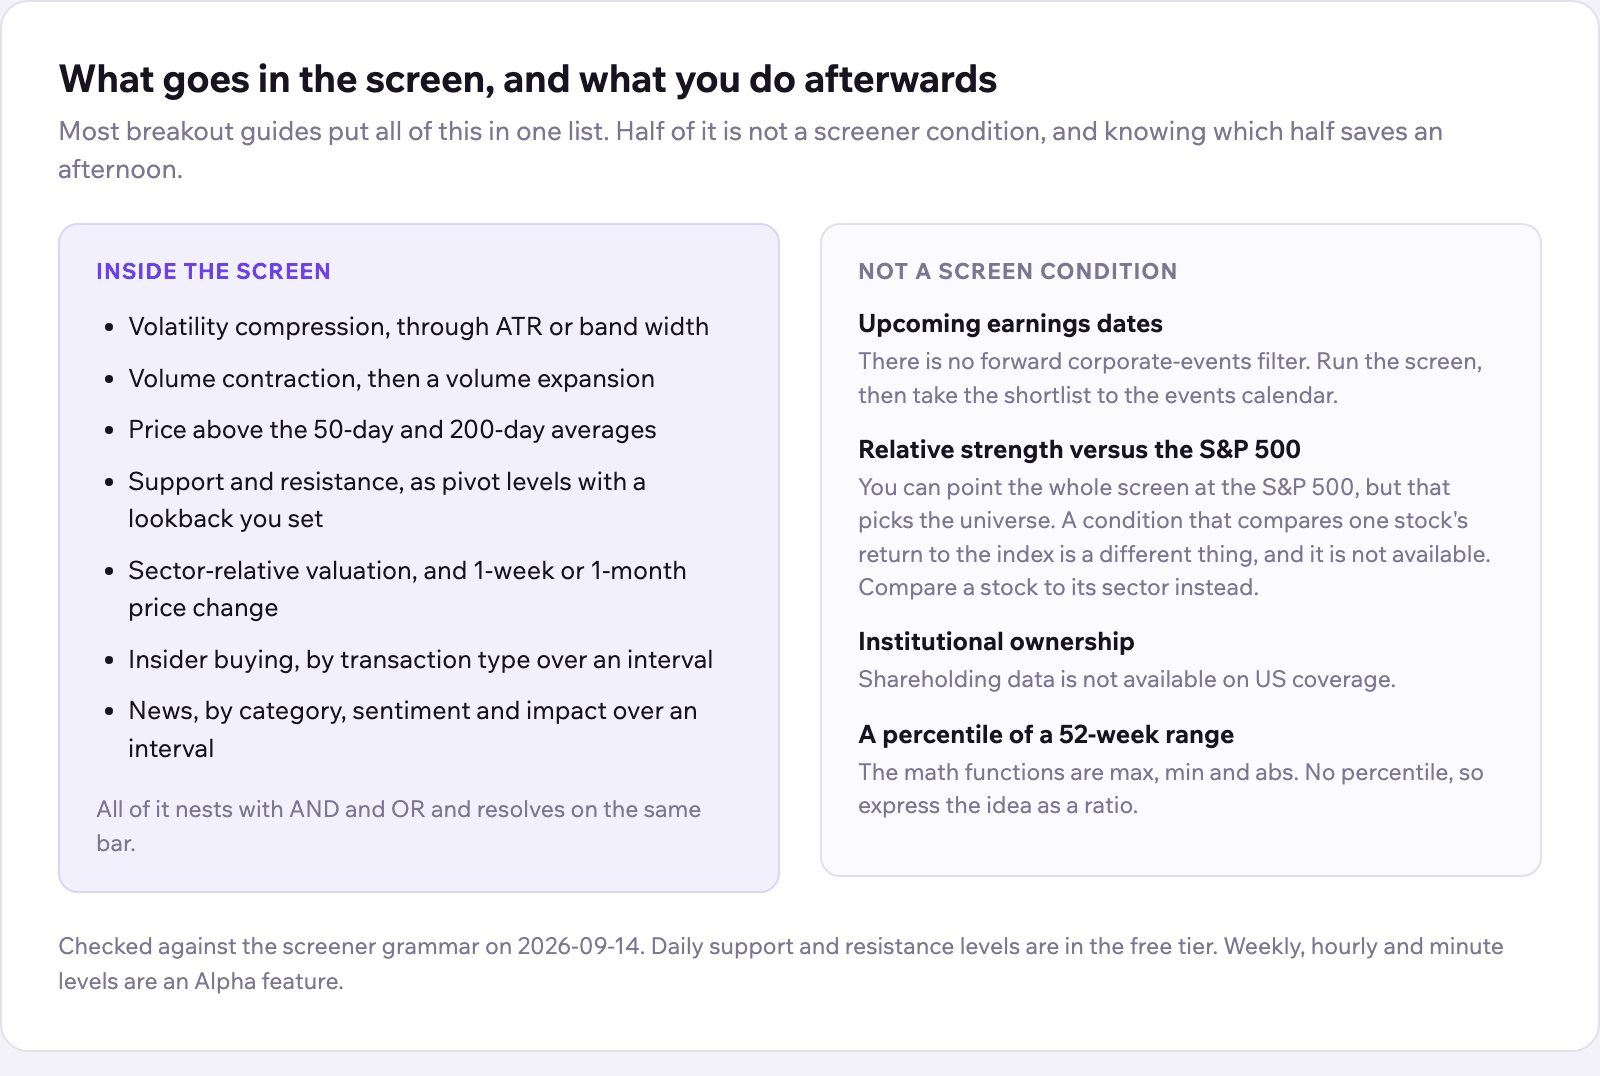
Be careful how you state this one. On US coverage you compare a stock to its sector, not to a benchmark index: sector weighted average P/E and P/B are the relative measures that exist, alongside one-week and one-month price change and the sector heatmap for the top-down view. You can point the whole screen at the S&P 500, which sets the universe it runs over. That is a different thing from a condition that measures one stock against the index, and the second one is not part of the US screener. So the honest version of relative strength here is sector-relative, plus your own read of the index chart.
What Catalyst Turns Compression Into a Breakout?
A coiled chart is potential energy. Something has to release it.
Earnings
Earnings is the most common trigger. A stock building a tight base into a report can clear resistance in one session, and the base was there to see beforehand.
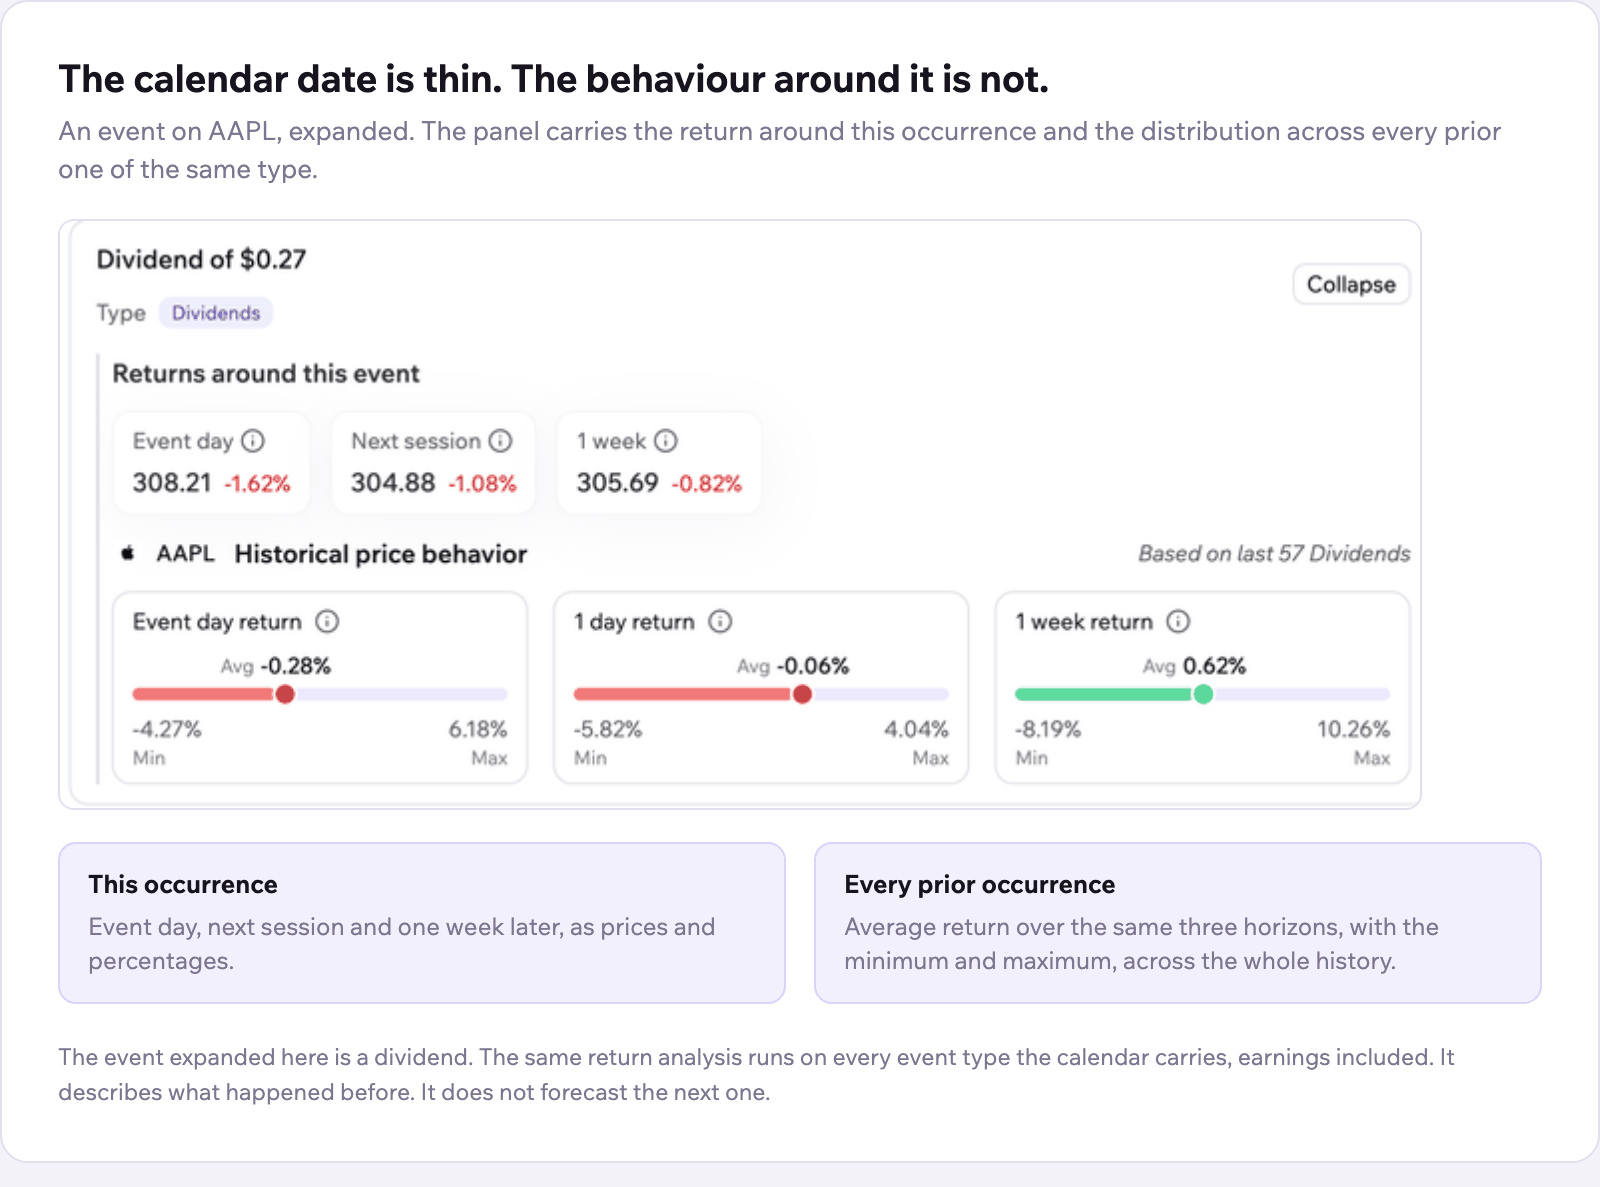
The date alone is thin information. What matters is how the stock has behaved around its previous reports: whether it tends to drift up in the two days before, whether it follows through in the week after a beat. The events calendar carries return analysis around prior announcements rather than the date on its own.
One limit worth stating plainly, because a lot of writing on this gets it wrong. Upcoming earnings is not a screener condition. There is no forward-events filter in the screener, so “reports in the next 14 days” is a step you do on the calendar, against the shortlist the screen gave you. It is not a line in the screen.
Insider Buying
When an officer or director buys on the open market, they are paying today’s price with their own money. That is not a forecast, and a single purchase proves very little. A cluster of purchases at the base of a compression pattern is worth a second look.
This one does compose. Insider deals are screenable as acquisitions or disposals over an interval, so insider acquisitions in the last month sit in the same expression as the technical conditions rather than in a separate tab. An acquisition can also be a grant or an option exercise, so confirm a purchase on the Form 4 before you count it.
Filings are also fast enough to be useful. The SEC requires Form 4 to be filed within two business days of the transaction date (SEC, Forms 3, 4 and 5), so an open-market purchase reaches the public record while the base is still forming.
Macro and Sector Events
A rate decision or a sector-wide announcement can move every base in a sector at once. The FOMC holds eight regularly scheduled meetings a year plus others as needed (Federal Reserve), so most of the macro calendar is known months ahead.
News itself is screenable by category, sentiment and impact over an interval, so “positive news at high impact in the last five sessions” is a condition, not a reading exercise. The news feed is the browsing version of the same data.
How Do You Check Multiple Timeframes in One Screen?
Acting on a daily signal without checking the weekly is how you buy a breakout into overhead resistance.
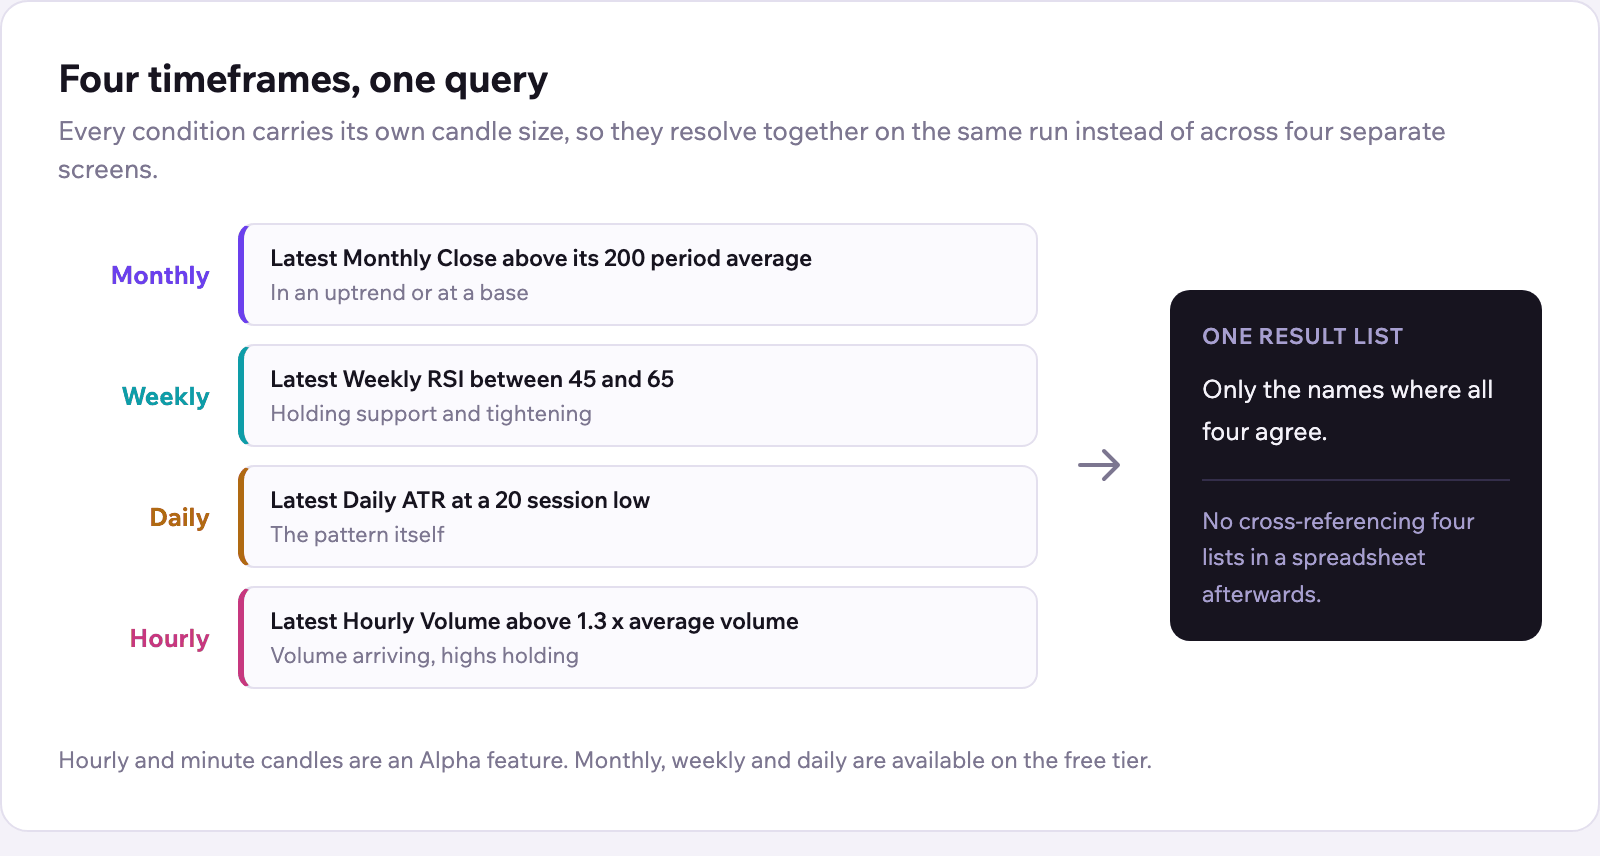
The check is simple to describe. Monthly in an uptrend or at a base. Weekly holding support and tightening. Daily showing the pattern. Hourly showing volume arriving and price holding its intraday highs.
Doing it by hand across four screens does not scale past a handful of names. Stating it once does. Conditions in the screener carry their own candle size, so a weekly RSI condition, a daily band-width condition and an hourly volume condition sit in one query and resolve together. Hourly and minute candles are an Alpha feature and are not in the free tier.
How to Build a Pre-Breakout Screen
A working shape, not a formula. Change the numbers to fit how you trade. Set the universe first, since the screen runs over a list you choose, such as the S&P 500 or a single sector.
Compression
- ATR at a 20-day low
- Upper band minus lower band under five percent of the close
- Close above both the 50-day and 200-day averages
Participation
- Average volume over five sessions below the 20-day average
- Most recent session volume at least 30 percent above the 20-day average
Quality, optional
- Positive year-on-year revenue growth
- P/E below the sector weighted average
Catalyst
- Insider buying in the last 30 days
- Positive news at high impact in the last five sessions
Conditions nest with AND and OR and everything resolves on the same bar, so this is one screen rather than four lists intersected in a spreadsheet afterwards. You can also describe a condition in plain English and let the screener build the filter logic, then open it and edit the parameters yourself. The prebuilt technical screens are a reasonable starting point if you would rather edit something than start from an empty screen.
Then take the shortlist to the events calendar and drop anything that reports tomorrow, unless holding through a print is something you actually want.
How Do You Backtest a Breakout Screen?
A screen that reads well can still have no history behind it.
The question to answer is narrow. When stocks met these conditions in the past, what happened over the next 5, 10 and 20 sessions? Did the screen fire often enough to matter? Was the average gain bigger than the average loss?
Backtesting runs on the saved screen itself, so the same conditions you would trade are the ones tested. It reports, per stock, how often the screen triggered, the historical win rate, the average return, which holding period did best, and a trade log carrying maximum favourable and maximum adverse excursion on every occurrence. Basic gets 50 candles of history and two runs a day. Alpha lifts that to 500 candles and unlimited runs.
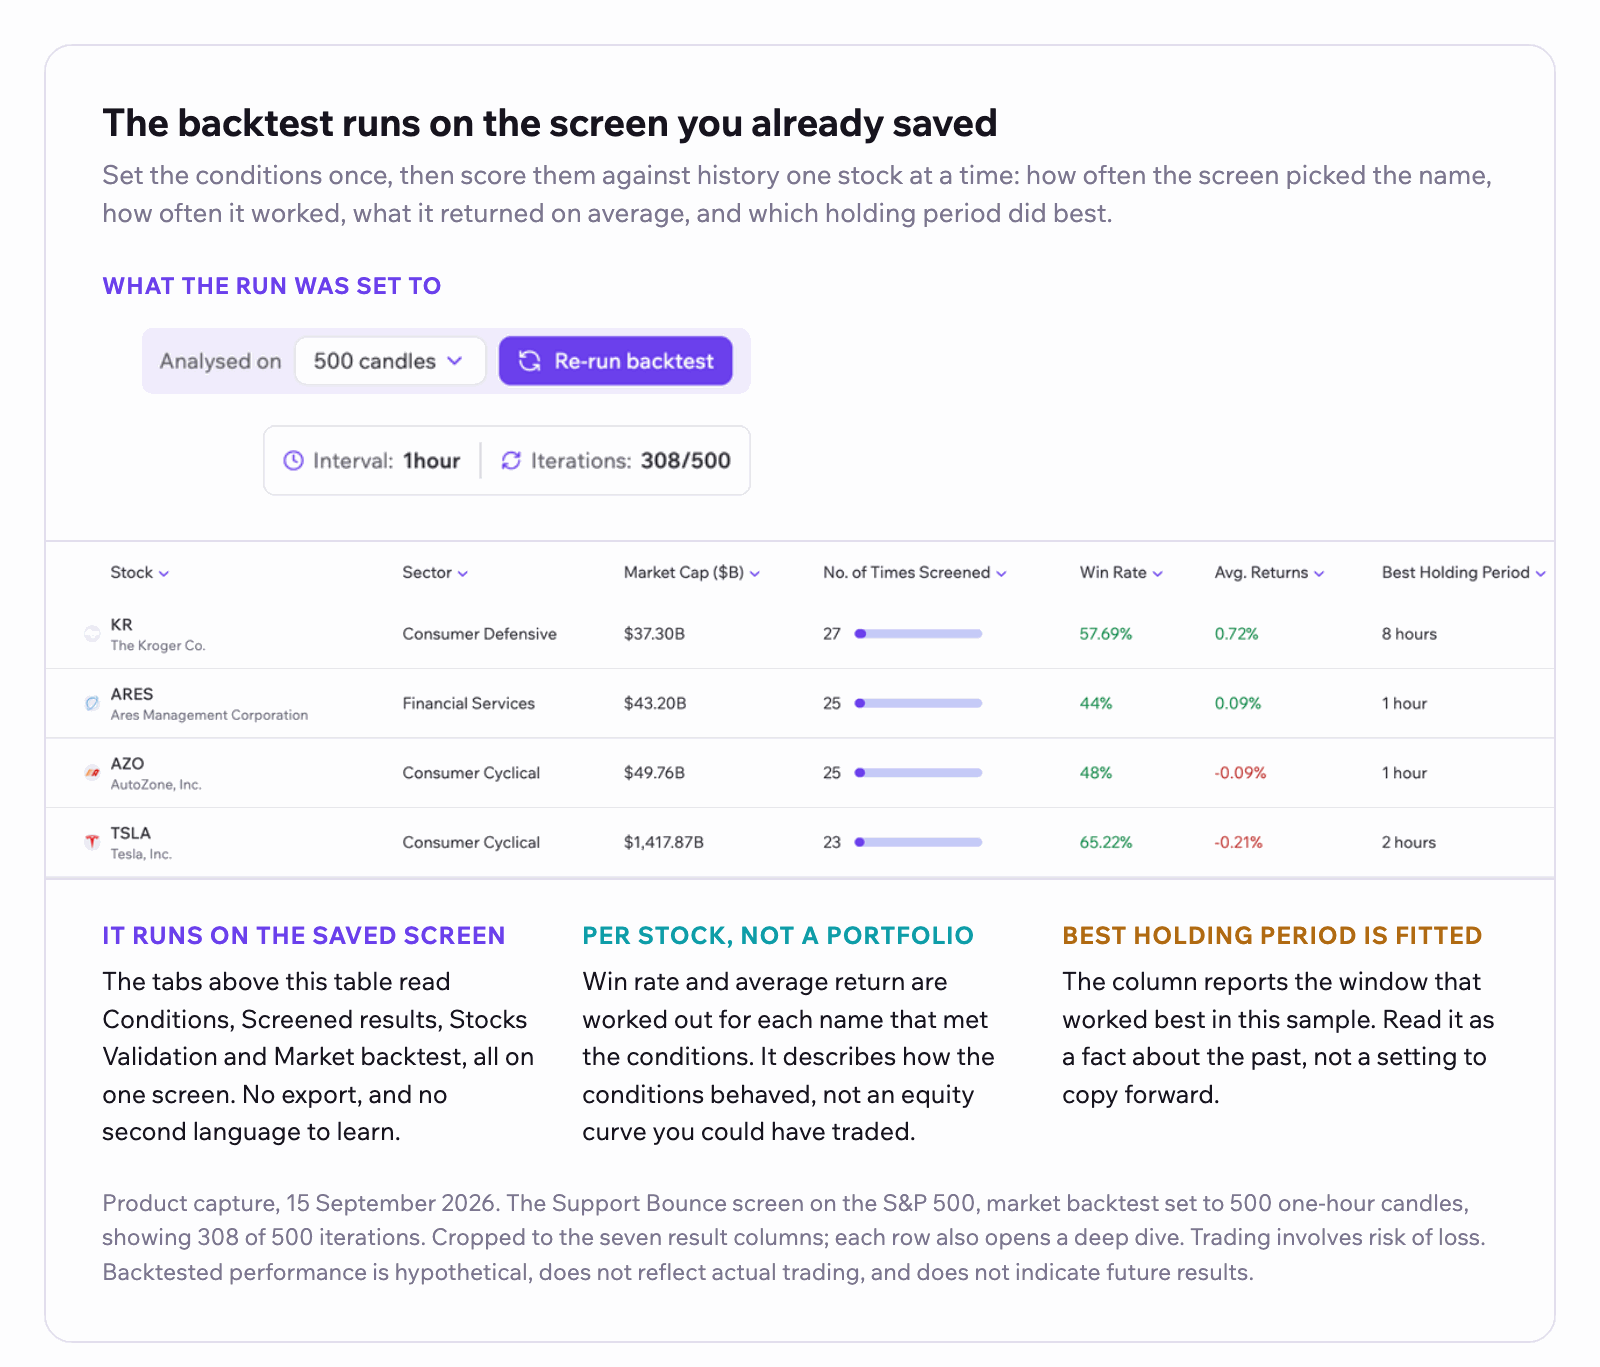
The useful exercise is not the first run. It is the second. Remove one condition, run it again, and compare. If the numbers barely move, that condition was decoration.
Trading involves risk of loss. Backtested performance is hypothetical, does not reflect actual trading, and does not indicate future results.
Does Seasonality Help Time the Entry?
Sometimes, and it is a tiebreaker rather than a reason.
Some names have produced their strongest returns in particular months across many years, which reflects earnings cycles and sector rotation rather than anything mystical. A compressed base in a month where that name has a strong record is a better candidate than the same base in a weak one.
The Historical Swing Screener ranks names by average return and hit rate for an entry date, holding period and direction you set, computed on each instrument’s own price history rather than on an index-level pattern. Same caveat as any backtest: it describes what happened, not what will.
The Pre-Breakout Workflow, Start to Finish
- Screen for compression. Volatility contracted, price above its averages. This is the candidate list.
- Add the catalyst layer. Insider buying, news sentiment and impact. This is the same screen, not a second one.
- Confirm across timeframes. Weekly and monthly agree with the daily, or the name is dropped.
- Check the calendar. Upcoming earnings against the shortlist, since it is not a screen condition.
- Backtest, then remove one condition and backtest again. Keep what changes the numbers.
If you want the shortlist explained rather than just listed, Dr. Market will pull the technicals for a single name from the same data the screener runs on and link every figure back to the page it came from. Ask it what NVDA looks like on the hourly, or where support sits on AAPL, and you get levels with sources attached rather than a paragraph of confident prose.
What This Method Cannot Tell You
It is worth being direct about the limits, because a screen that never fails is a screen that is lying to you.
Compression resolves in both directions. A tight base with rising volume and an insider purchase can still break down, and nothing in the screen distinguishes the two cases in advance. Backtests are hindsight by construction: the conditions were chosen knowing what happened next, so the results are an upper bound on what you should expect. Insider buying is a weak signal on its own and the literature on it is mixed. Seasonality on a single name is computed on a small number of observations.
None of that makes the process worthless. It makes it a process, which is the point. You are not looking for certainty. You are looking for a repeatable way to be early more often than late, with the evidence written down so you can tell which part was doing the work.
Start on the free tier. Build one screen you already half-trust, backtest it, pull out a condition, run it again. That exercise teaches more than any list of indicators, this one included. Pricing is there when you want the longer history and the intraday candles.
DISCLAIMER: This article is for educational and informational purposes only. It does not constitute investment advice or a research report.